Fig. 4.
Download original image
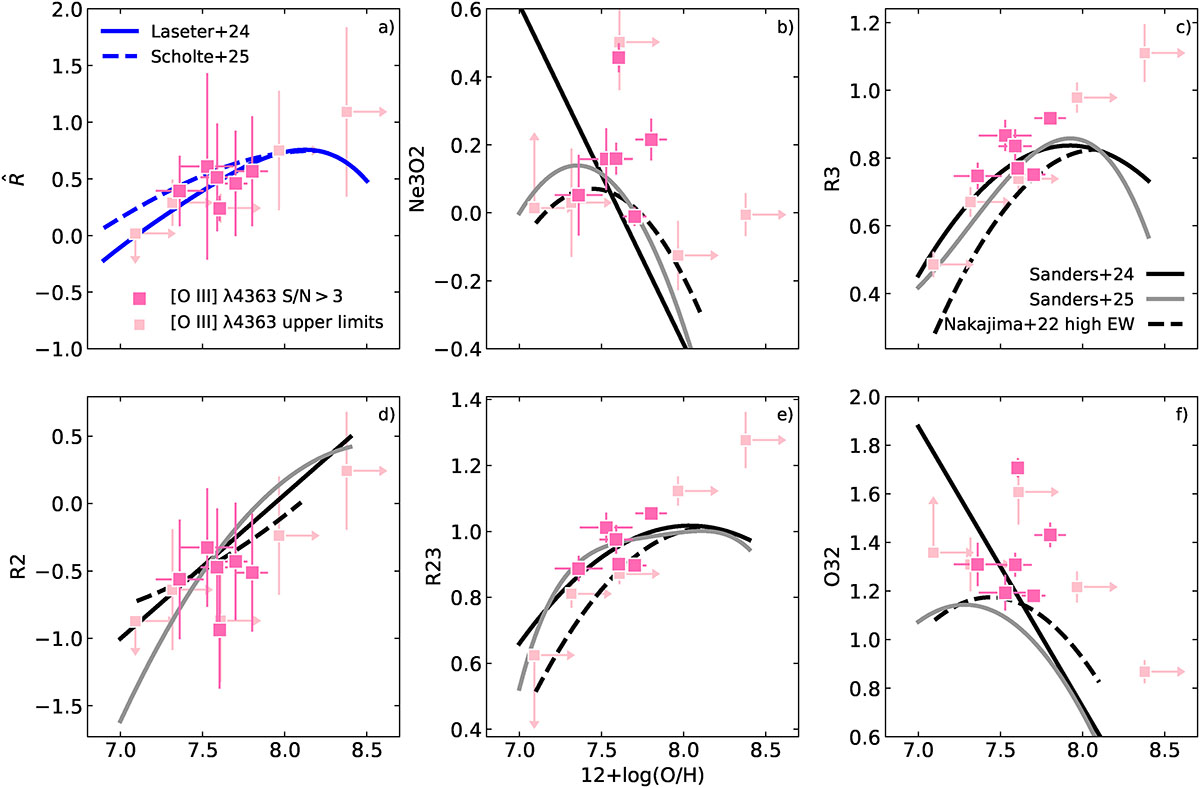
Te-based metallicities and strong-line ratios for the z > 9 sample. Direct oxygen abundances are represented by hot pink square markers, with 3σ upper limits in pale pink. We compare to various literature strong-line diagnostics: the solid and dashed blue relations show Laseter et al. (2024) and Scholte et al. (2025)
![]() calibrations, while the solid and dashed black curves are Ne3O2, R3, R2, R23, O32 diagnostics from Sanders et al. (2024), Sanders et al. (2025) and Nakajima et al. (2022), respectively.
calibrations, while the solid and dashed black curves are Ne3O2, R3, R2, R23, O32 diagnostics from Sanders et al. (2024), Sanders et al. (2025) and Nakajima et al. (2022), respectively.
Current usage metrics show cumulative count of Article Views (full-text article views including HTML views, PDF and ePub downloads, according to the available data) and Abstracts Views on Vision4Press platform.
Data correspond to usage on the plateform after 2015. The current usage metrics is available 48-96 hours after online publication and is updated daily on week days.
Initial download of the metrics may take a while.