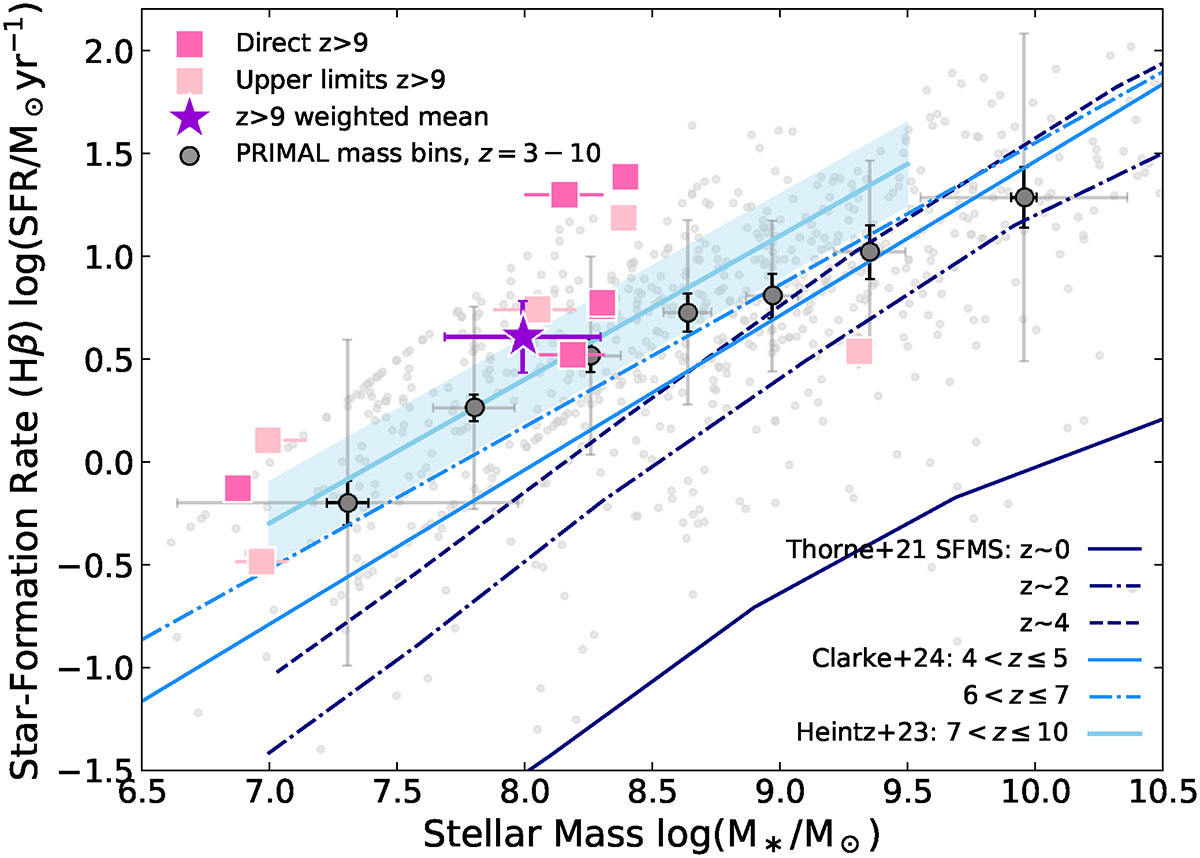
Fig. 6.
Download original image
Star-forming galaxy SFR − M★ main-sequence. The z > 9 galaxies are plotted in pink, with the weighted mean of the sample represented by the purple star. To compare, we plot the PRIMAL sample at z = 3 − 10 as grey points, with the median of stellar mass bins indicated by grey markers. The solid black error bars on these markers represent the error on the median, with grey error bars showing the standard deviation of the bin. We also plot the linear relation (and empirical scatter) of the best-fit SFMS for z = 7 − 10 from Heintz et al. (2023a) in light blue, with dark blue curves showing the evolution of the best-fit main sequence for z ∼ 0 − 4 from Thorne et al. (2021) and z ∼ 4 − 7 from Clarke et al. (2024).
Current usage metrics show cumulative count of Article Views (full-text article views including HTML views, PDF and ePub downloads, according to the available data) and Abstracts Views on Vision4Press platform.
Data correspond to usage on the plateform after 2015. The current usage metrics is available 48-96 hours after online publication and is updated daily on week days.
Initial download of the metrics may take a while.