Fig. 8.
Download original image
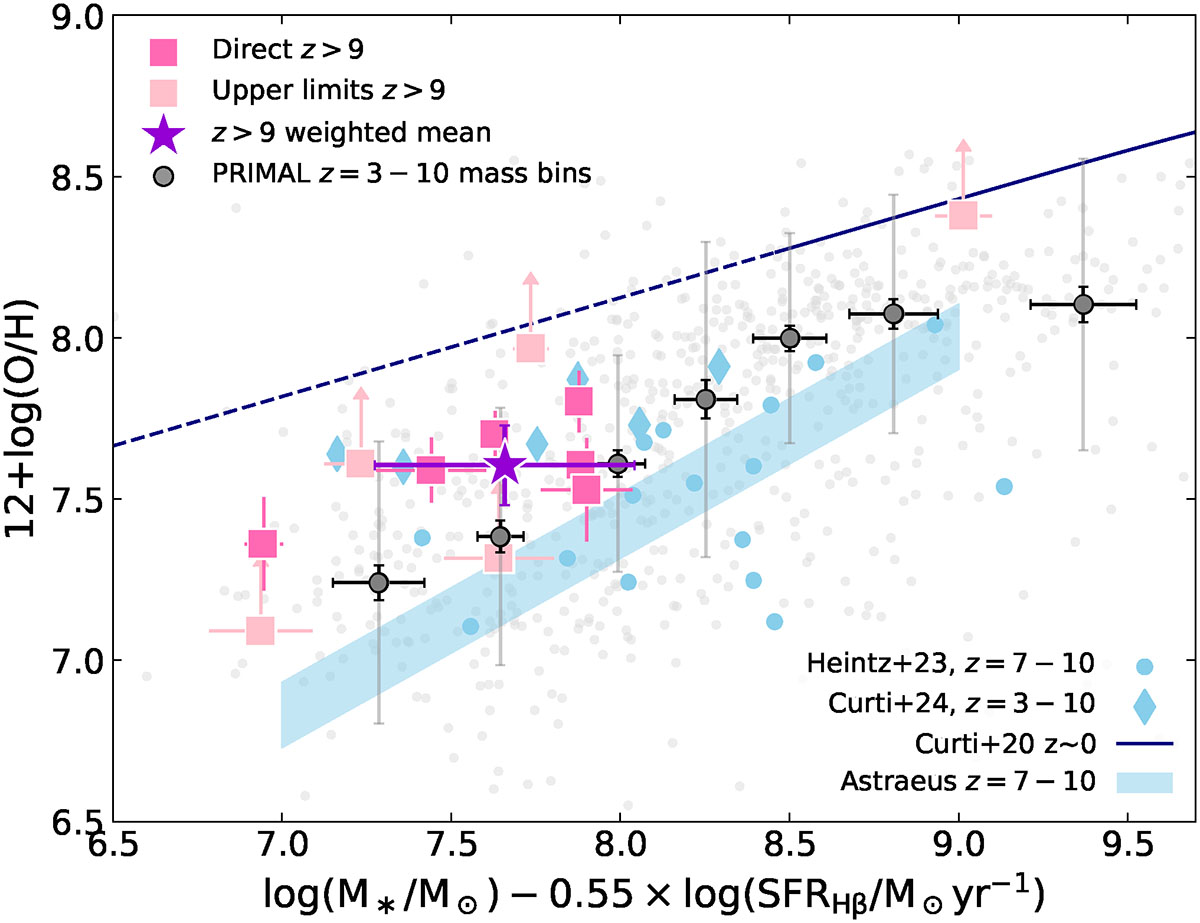
Fundamental metallicity relation at z > 9. Direct Te metallicities and upper limits for the z > 9 sample are shown in hot pink and light pink, respectively, with the weighted mean of the sample indicated by the purple star. The local FMR (Curti et al. 2020) is plotted in dark blue, and extrapolated to lower μα. Grey scatter points represent the PRIMAL z = 3 − 10 sample, with grey markers being the median of stellar mass bins. The solid black and grey error bars on these points represent the error on the median, and the standard deviation of each bin, respectively. We compare to previous high-z JWST results with diamonds from Curti et al. (2024) and circles from Heintz et al. (2023a). The shaded blue region shows predictions from the Astraeus simulations for z = 7 − 10.
Current usage metrics show cumulative count of Article Views (full-text article views including HTML views, PDF and ePub downloads, according to the available data) and Abstracts Views on Vision4Press platform.
Data correspond to usage on the plateform after 2015. The current usage metrics is available 48-96 hours after online publication and is updated daily on week days.
Initial download of the metrics may take a while.