Fig. 9.
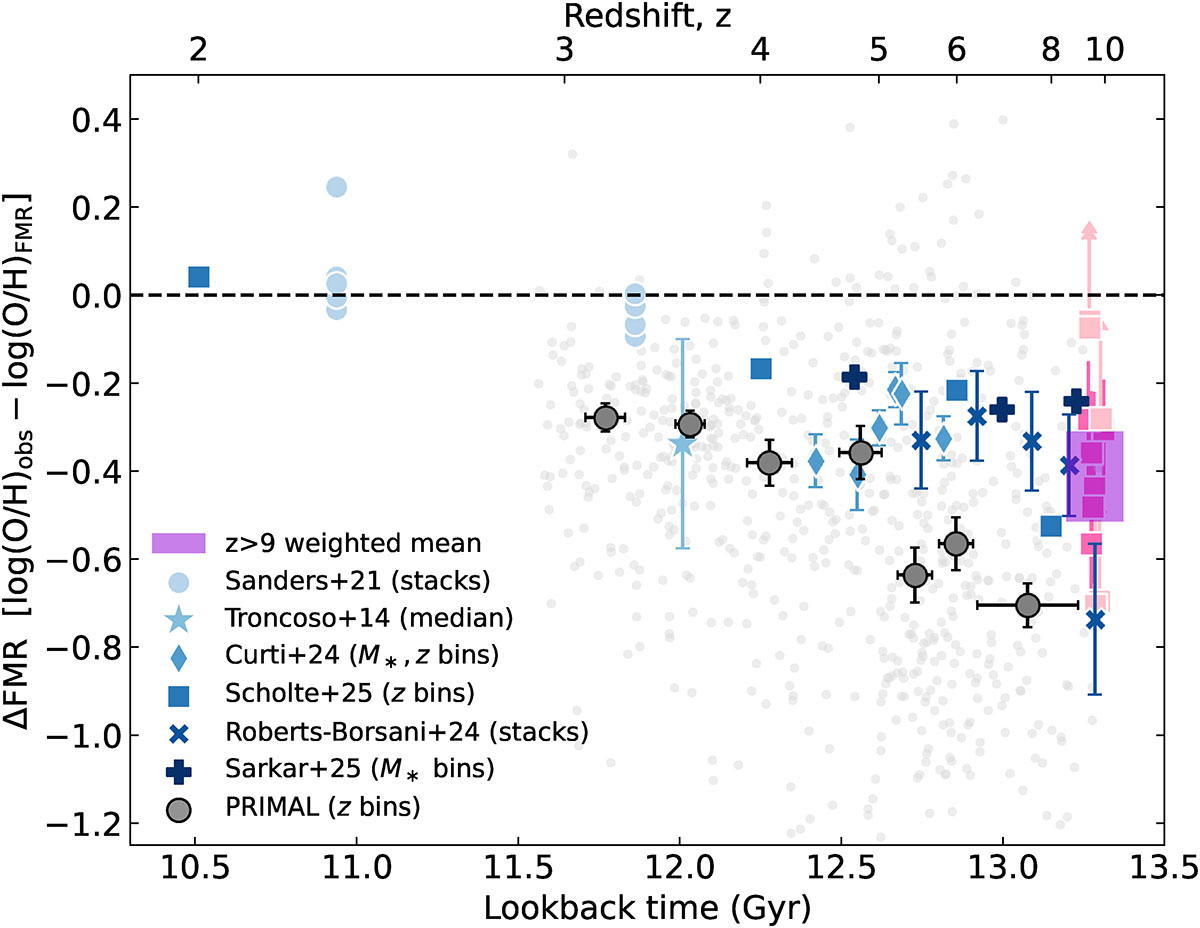
Download original image
Offset from the FMR, plotted against look-back time and redshift, down to z ∼ 2. The weighted mean of z > 9 direct-metallicity sample is shown by the purple box, with height and width spanning 1σ error, and individual galaxies are plotted in pink. We compare to redshift bins of the PRIMAL z = 3 − 10 sample, shown as circular grey markers, with error bars representing the error on the bin medians. Other binned or stacked high-z (z > 2) literature data, from Sanders et al. (2021), Troncoso et al. (2014), Curti et al. (2024), Scholte et al. (2025), Roberts-Borsani et al. (2024), and Sarkar et al. (2025), are shown in different shades of blue. There is a clear trend indicating that the offset from the FMR increases with redshift, with a systematic break somewhere between 2.5 < z < 3.0.
Current usage metrics show cumulative count of Article Views (full-text article views including HTML views, PDF and ePub downloads, according to the available data) and Abstracts Views on Vision4Press platform.
Data correspond to usage on the plateform after 2015. The current usage metrics is available 48-96 hours after online publication and is updated daily on week days.
Initial download of the metrics may take a while.