Fig. 1.
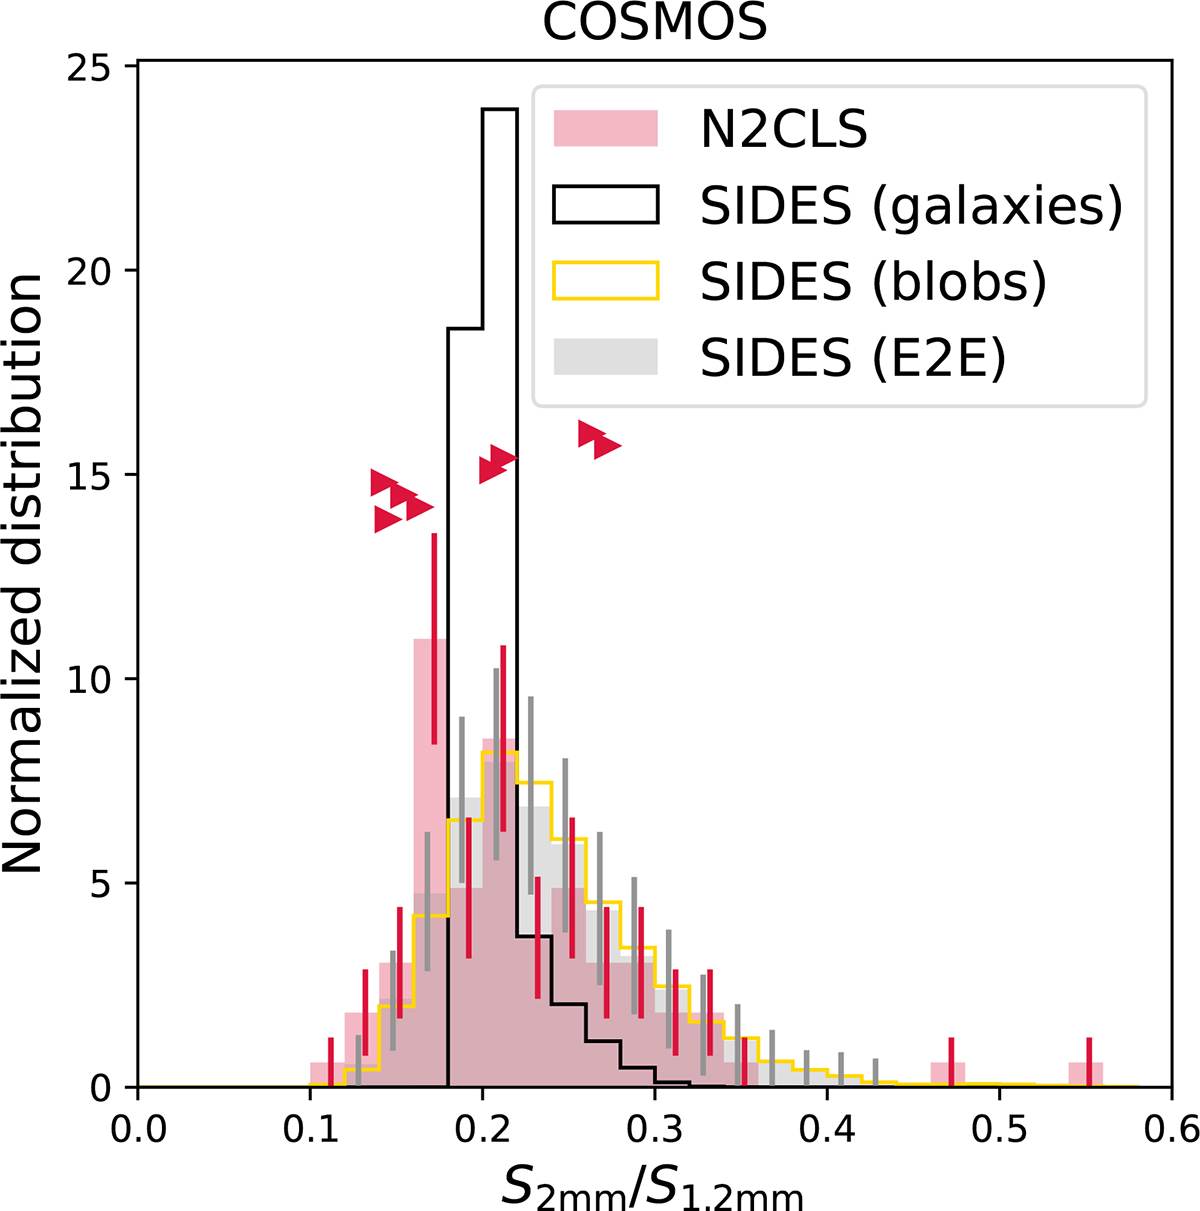
Download original image
Distribution of the 2–1.2 mm color for the true N2CLS COSMOS catalog (red filled histogram, only S/N ≥4.6 sources at both wavelengths and various simulated catalogs based on SIDES. The solid black histogram corresponds to the simulated SIDES galaxy catalog after applying a flux cut similar to COSMOS data (see Sect. 3.1). The yellow histogram is based on a similar selection, but applied to the blob catalog extracted from the noiseless simulated map. The grey histogram is the distribution obtained using the E2E simulation described in Sect. 2.5. The error bars on the N2CLS histogram are computed assuming a Poisson law, and those from the E2E are the standard deviation between the various simulated fields. The histograms are normalized to have a unity area (∫n(c) dc = 1, where c is the color). The lower limits on the color of 1.2 mm non-detections are shown as right-pointing triangles. Their y-axis position is arbitrary and was chosen to reduce overcrowding in the figure.
Current usage metrics show cumulative count of Article Views (full-text article views including HTML views, PDF and ePub downloads, according to the available data) and Abstracts Views on Vision4Press platform.
Data correspond to usage on the plateform after 2015. The current usage metrics is available 48-96 hours after online publication and is updated daily on week days.
Initial download of the metrics may take a while.