Fig. 4.
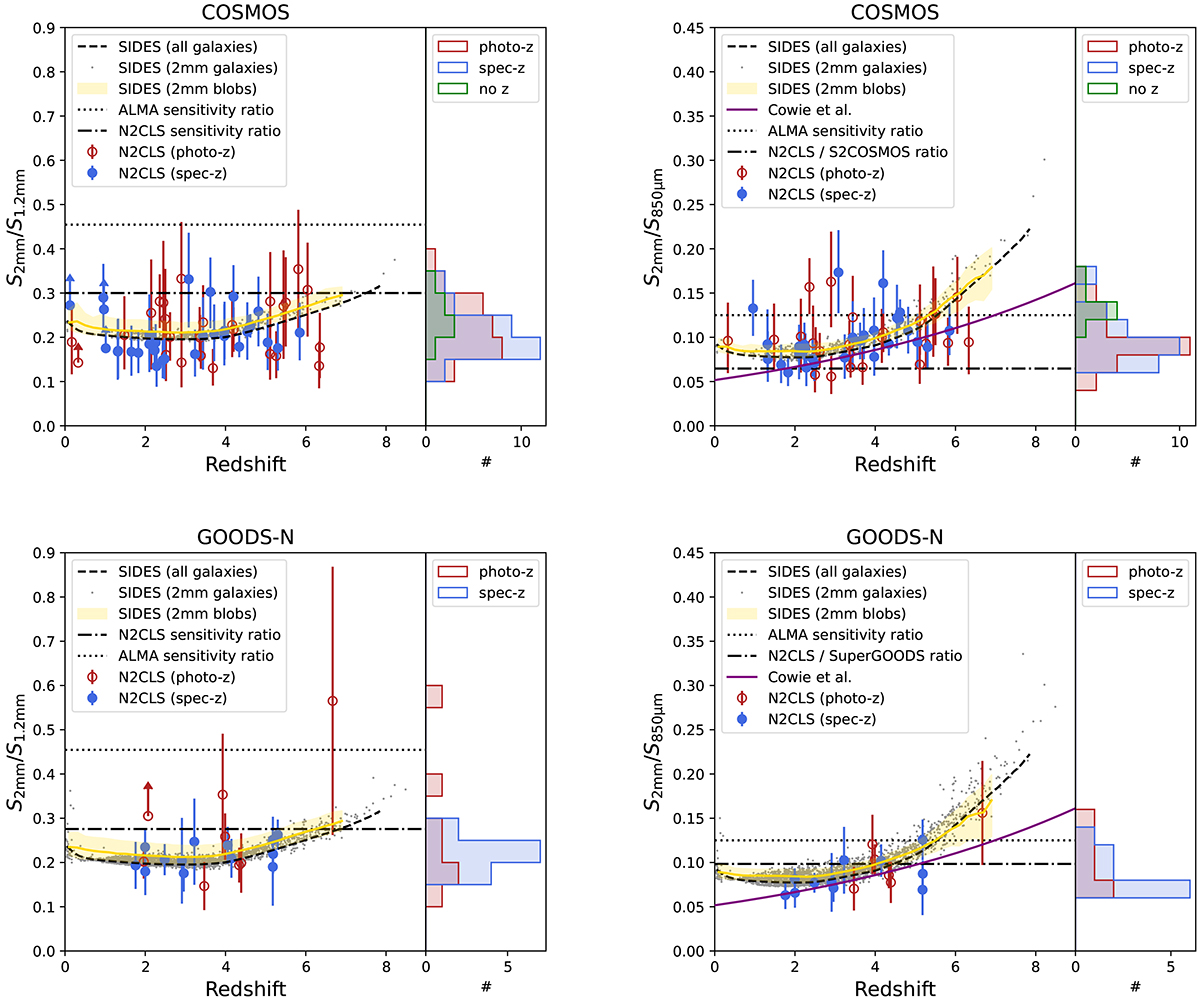
Download original image
Color as a function of the redshift in the COSMOS (top) and GOODS-N (bottom) fields. The left plots show the internal NIKA2 color (S2 mm/S1.2 mm) and the right ones show the ratio between the N2CLS 2 mm and the SCUBA2 850 μm fluxes from S2COSMOS (Simpson et al. 2017) and SUPER GOODS (Cowie et al. 2017). The filled blue circle are the N2CLS sources with spectroscopic redshifts, while the open red circles corresponds to photometric redshifts. The grey dots are from the SIDES 2 deg2 simulated catalog after applying a 2 mm flux selection similar to SIDES (see Sect. 3.2). The yellow solid line corresponds to the median of the SIDES blob catalog, using the redshift of the brightest galaxy in the beam, and the colored area correspond to the 1σ confidence region. The dashed line is the mean color as a function of redshift from SIDES 2 deg2 without applying any selection. We also show the sensitivity ratio (σ2 mm/σ1.2 mm where σ2 mm and σ1.2 mm are the RMS of the noise at 2 mm and 1.2 mm, respectively) for ALMA (dotted line) and N2CLS (dot-dashed line). See the discussion in Sect. 4.1 for more details. The right-side panel of each plot show the color distribution of sources with a photometric redshift (red), a spectroscopic redshift (blue), and no redshift (green).
Current usage metrics show cumulative count of Article Views (full-text article views including HTML views, PDF and ePub downloads, according to the available data) and Abstracts Views on Vision4Press platform.
Data correspond to usage on the plateform after 2015. The current usage metrics is available 48-96 hours after online publication and is updated daily on week days.
Initial download of the metrics may take a while.