Fig. 8
Download original image
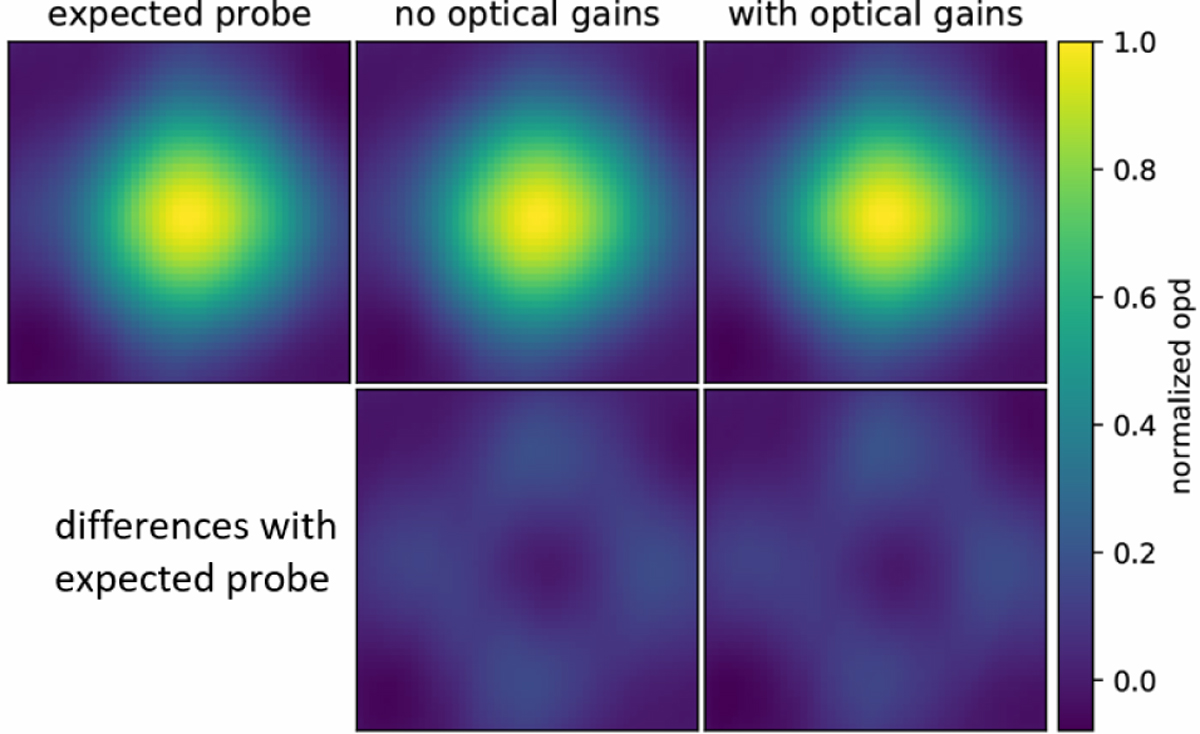
Pupil plane images zoomed in around the shape of the probe applied on the DM. The optical path difference is normalized to the maximum of the probe. Top row, left: expected probe, namely the influence function of the actuator. Middle: shape of the probe in closed loop without considering optical gains. Right: same as middle but including an optical gain calibration. Bottom row: differences between the obtain probe in closed loop and the expected probe. Science case: bright-1, seeing = 1.1″, τ0 = 3 ms.
Current usage metrics show cumulative count of Article Views (full-text article views including HTML views, PDF and ePub downloads, according to the available data) and Abstracts Views on Vision4Press platform.
Data correspond to usage on the plateform after 2015. The current usage metrics is available 48-96 hours after online publication and is updated daily on week days.
Initial download of the metrics may take a while.