Fig. 15
Download original image
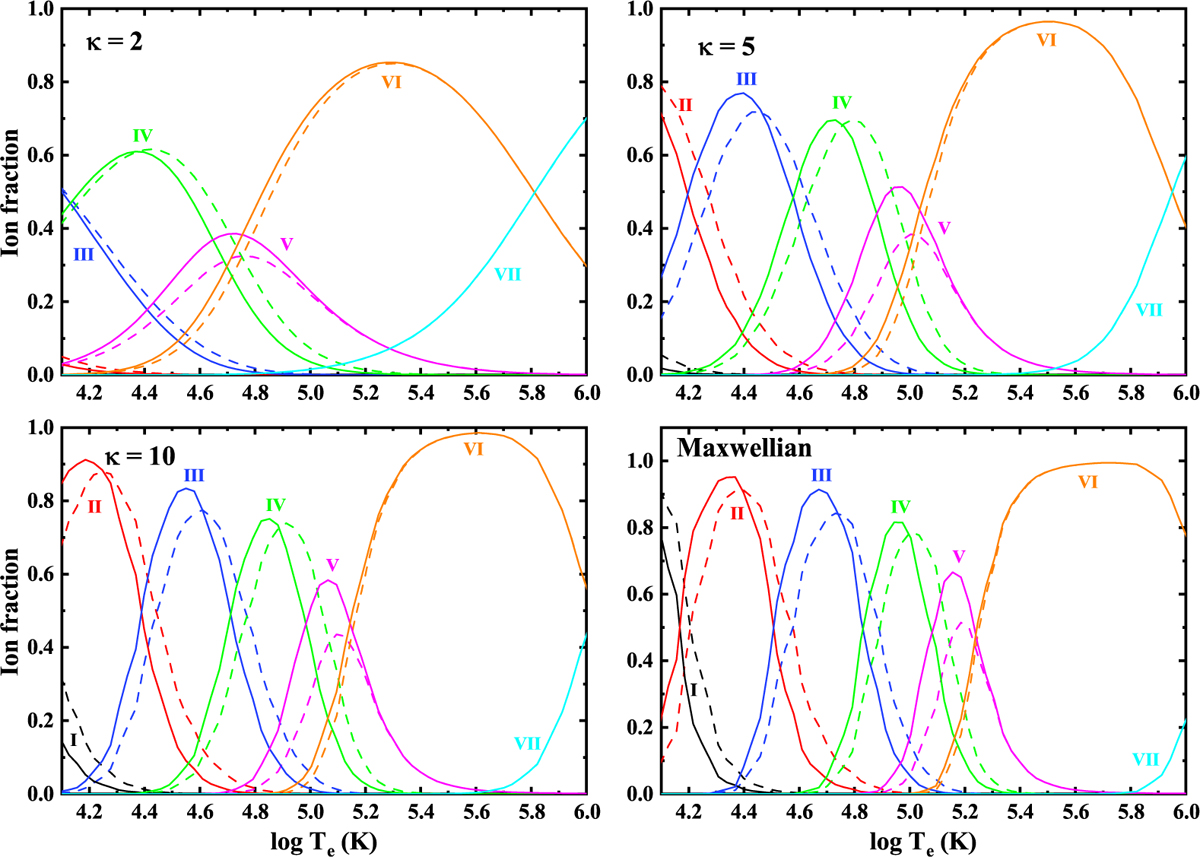
Ionization equilibrium of N, incorporating the influence of density suppression at a density of 1011 cm−3. Different colors correspond to different charge states. The solid lines denote the ionization equilibrium obtained with the density suppression effect included, whereas the dashed lines show the results without this suppression effect.
Current usage metrics show cumulative count of Article Views (full-text article views including HTML views, PDF and ePub downloads, according to the available data) and Abstracts Views on Vision4Press platform.
Data correspond to usage on the plateform after 2015. The current usage metrics is available 48-96 hours after online publication and is updated daily on week days.
Initial download of the metrics may take a while.