Open Access
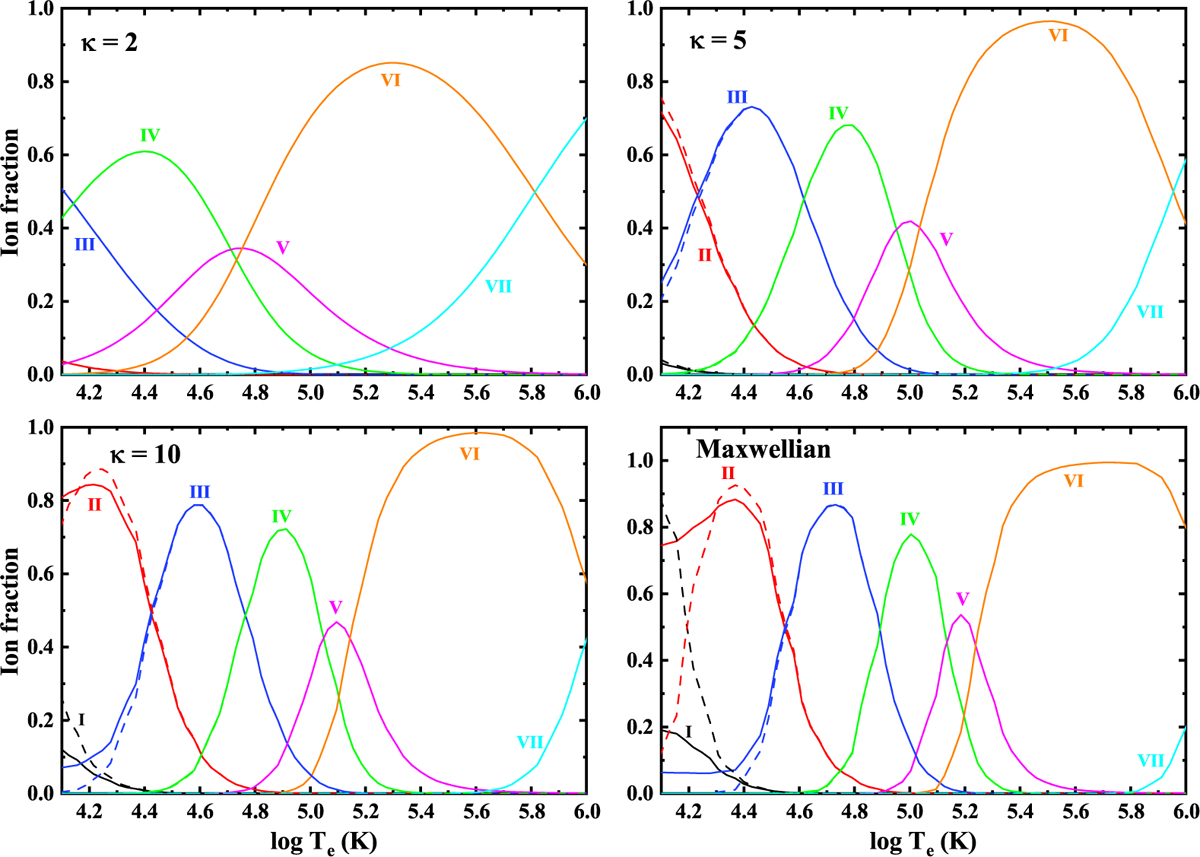
Fig. 16
Download original image
Influence of the PI process on the ionization equilibrium of nitrogen. Different colors correspond to different charge states, and the selected density is 1011 cm−3. The solid lines represent calculations that include the PI process, and the dashed lines correspond to those without it.
Current usage metrics show cumulative count of Article Views (full-text article views including HTML views, PDF and ePub downloads, according to the available data) and Abstracts Views on Vision4Press platform.
Data correspond to usage on the plateform after 2015. The current usage metrics is available 48-96 hours after online publication and is updated daily on week days.
Initial download of the metrics may take a while.