Open Access
Fig. A.5
Download original image
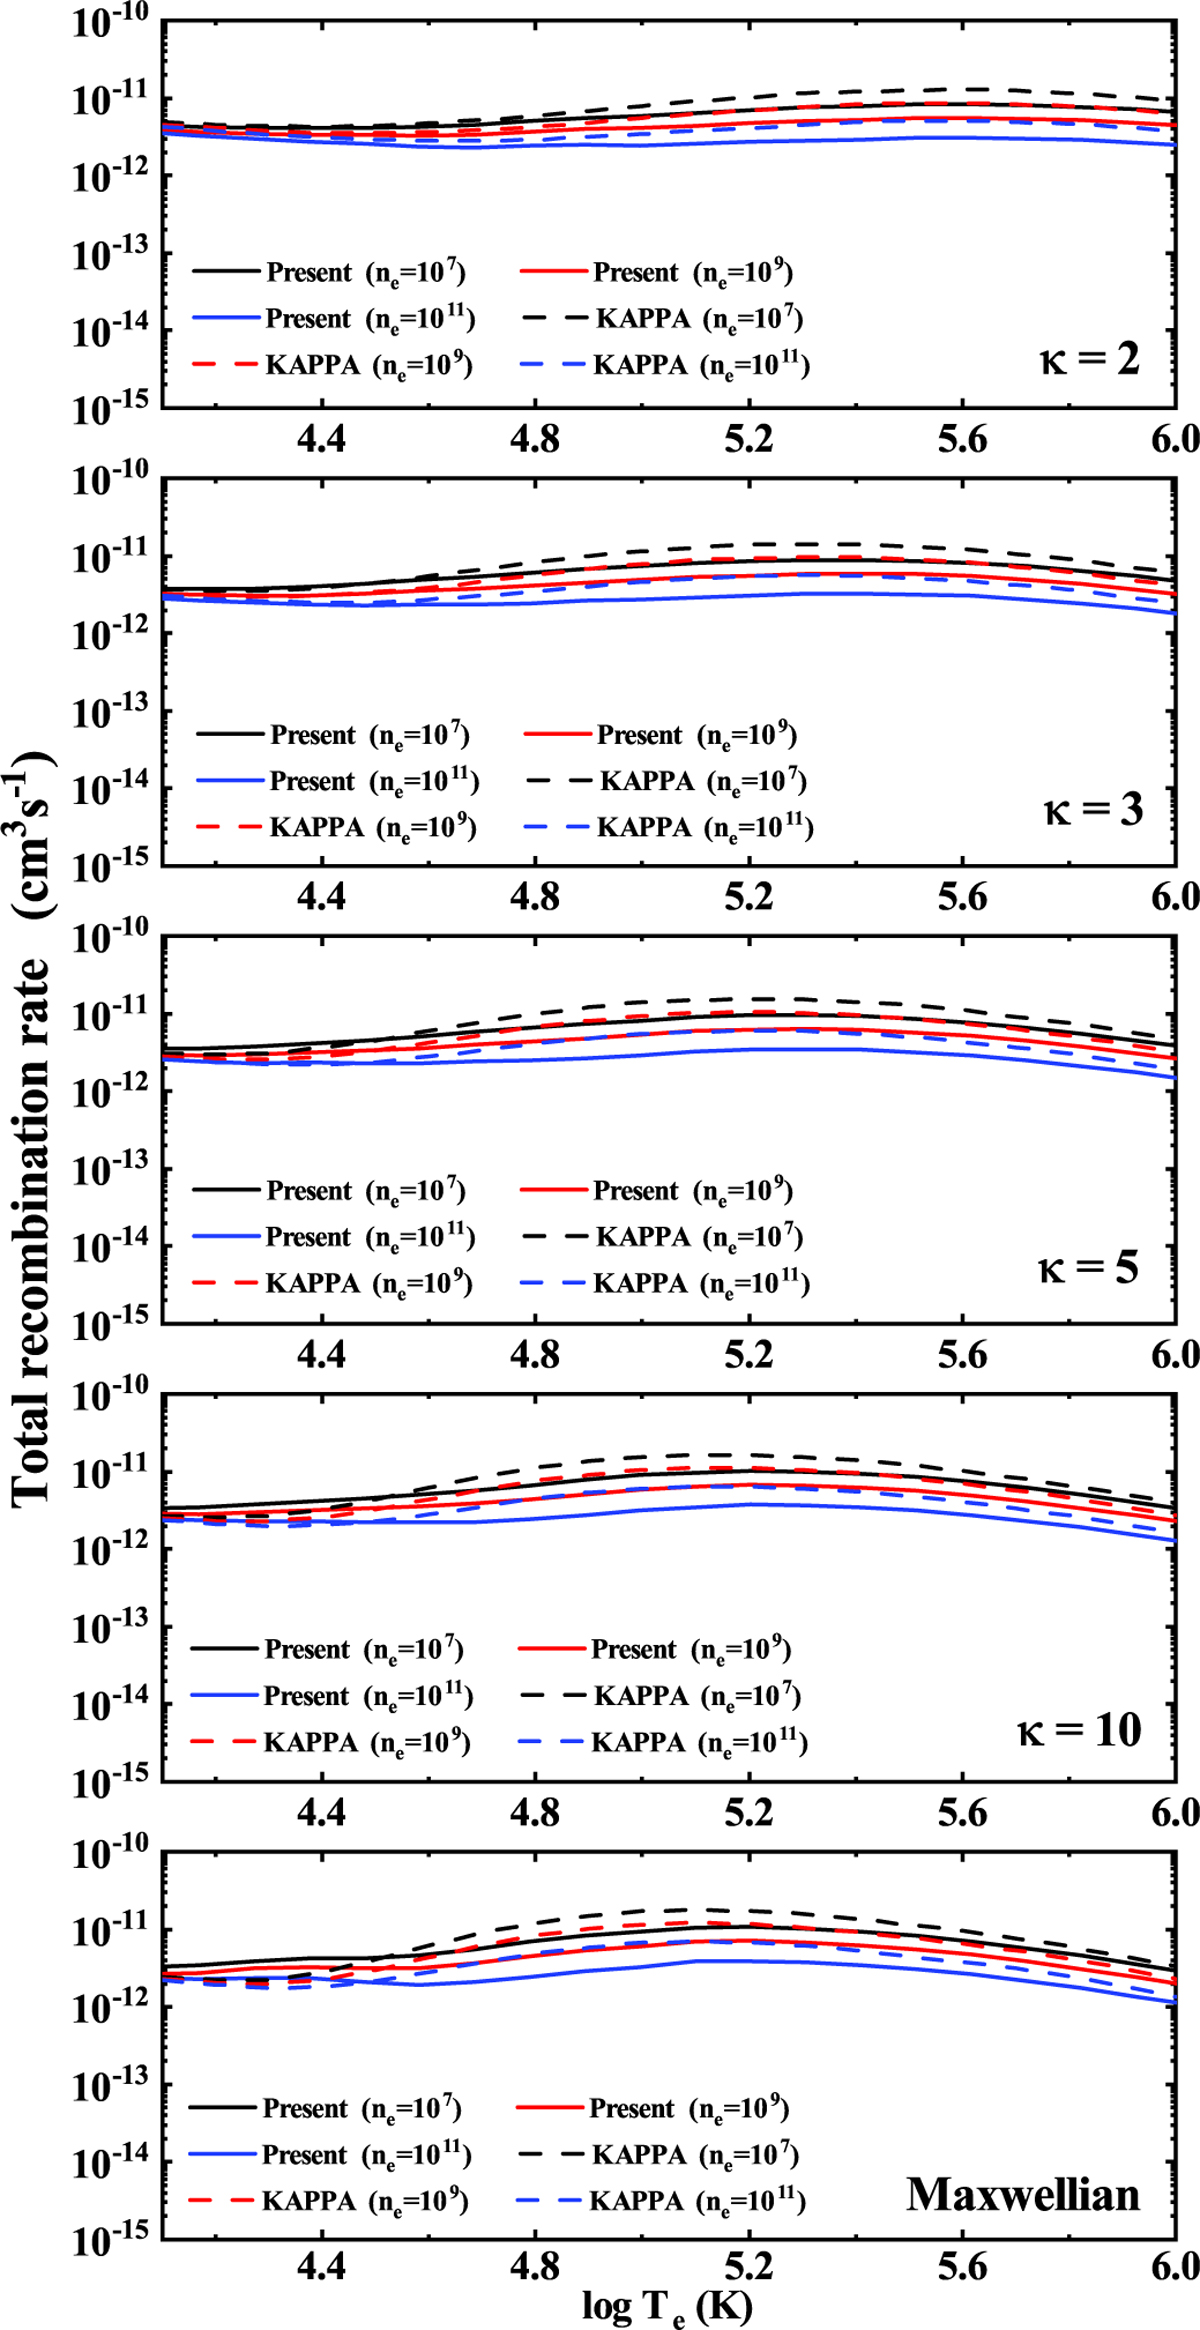
Comparison of total recombination rate coefficients between our calculations and KAPPA(Dzifčáková et al. 2021) of N III. The solid lines represent our calculated results, and the dashed lines represent the KAPPA results. Different colors correspond to different densities.
Current usage metrics show cumulative count of Article Views (full-text article views including HTML views, PDF and ePub downloads, according to the available data) and Abstracts Views on Vision4Press platform.
Data correspond to usage on the plateform after 2015. The current usage metrics is available 48-96 hours after online publication and is updated daily on week days.
Initial download of the metrics may take a while.