Fig. 5
Download original image
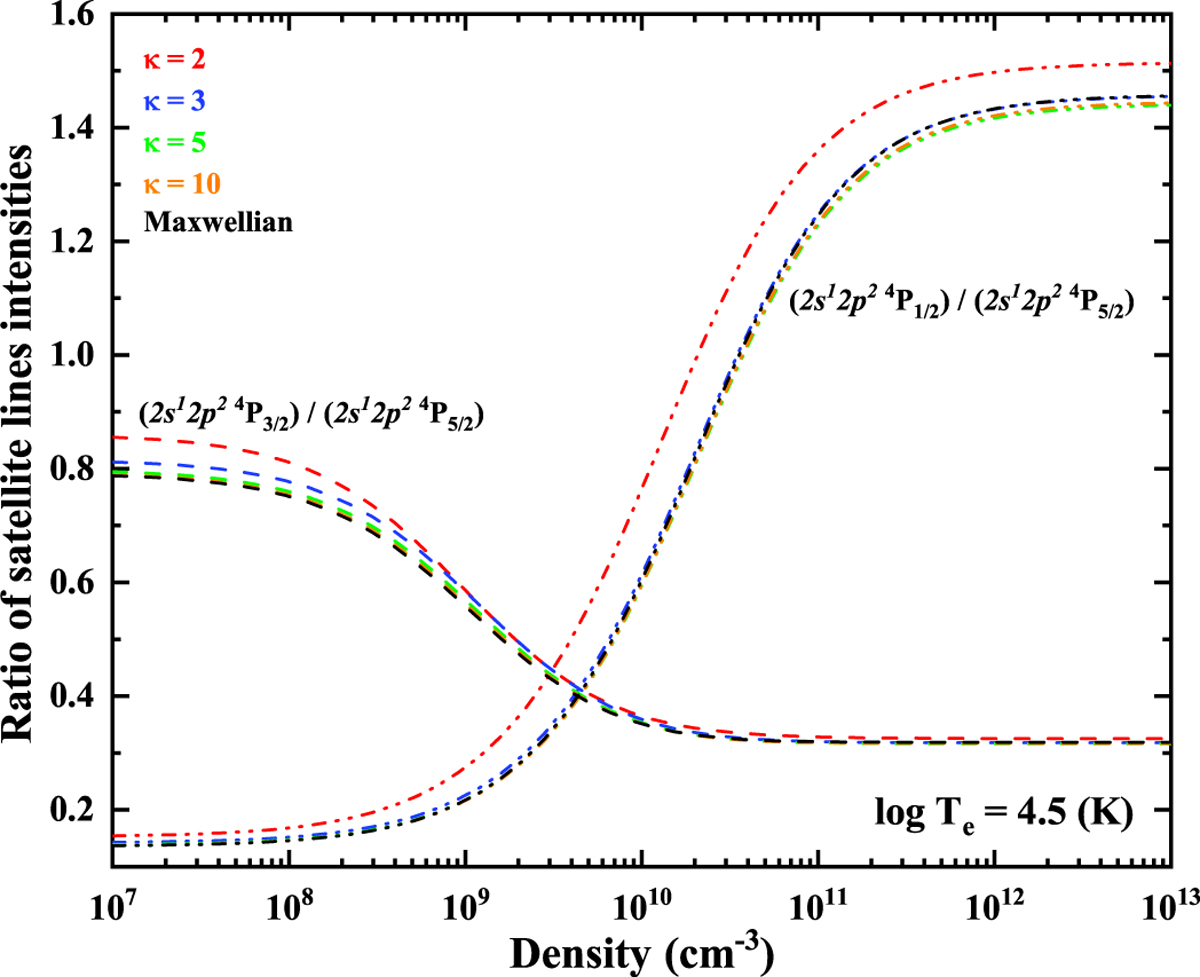
Dependence of the spectral intensity ratio of N III on electron density. The double-dot-dashed line represents the ratio of the transition intensity from 2s12p2 4P1/2 to 2s22p1 2P3/2 to that from 2s12p2 4P5/2 to 2s22p1 2P3/2 (R1). The dashed line represents the ratio of the transition intensity from 2s12p2 4P3/2 to 2s22p1 2P3/2 to that from 2s12p2 4P5/2 to 2s22p1 2P3/2 (R2). Different colors correspond to different energy distributions.
Current usage metrics show cumulative count of Article Views (full-text article views including HTML views, PDF and ePub downloads, according to the available data) and Abstracts Views on Vision4Press platform.
Data correspond to usage on the plateform after 2015. The current usage metrics is available 48-96 hours after online publication and is updated daily on week days.
Initial download of the metrics may take a while.