Open Access
Fig. 9
Download original image
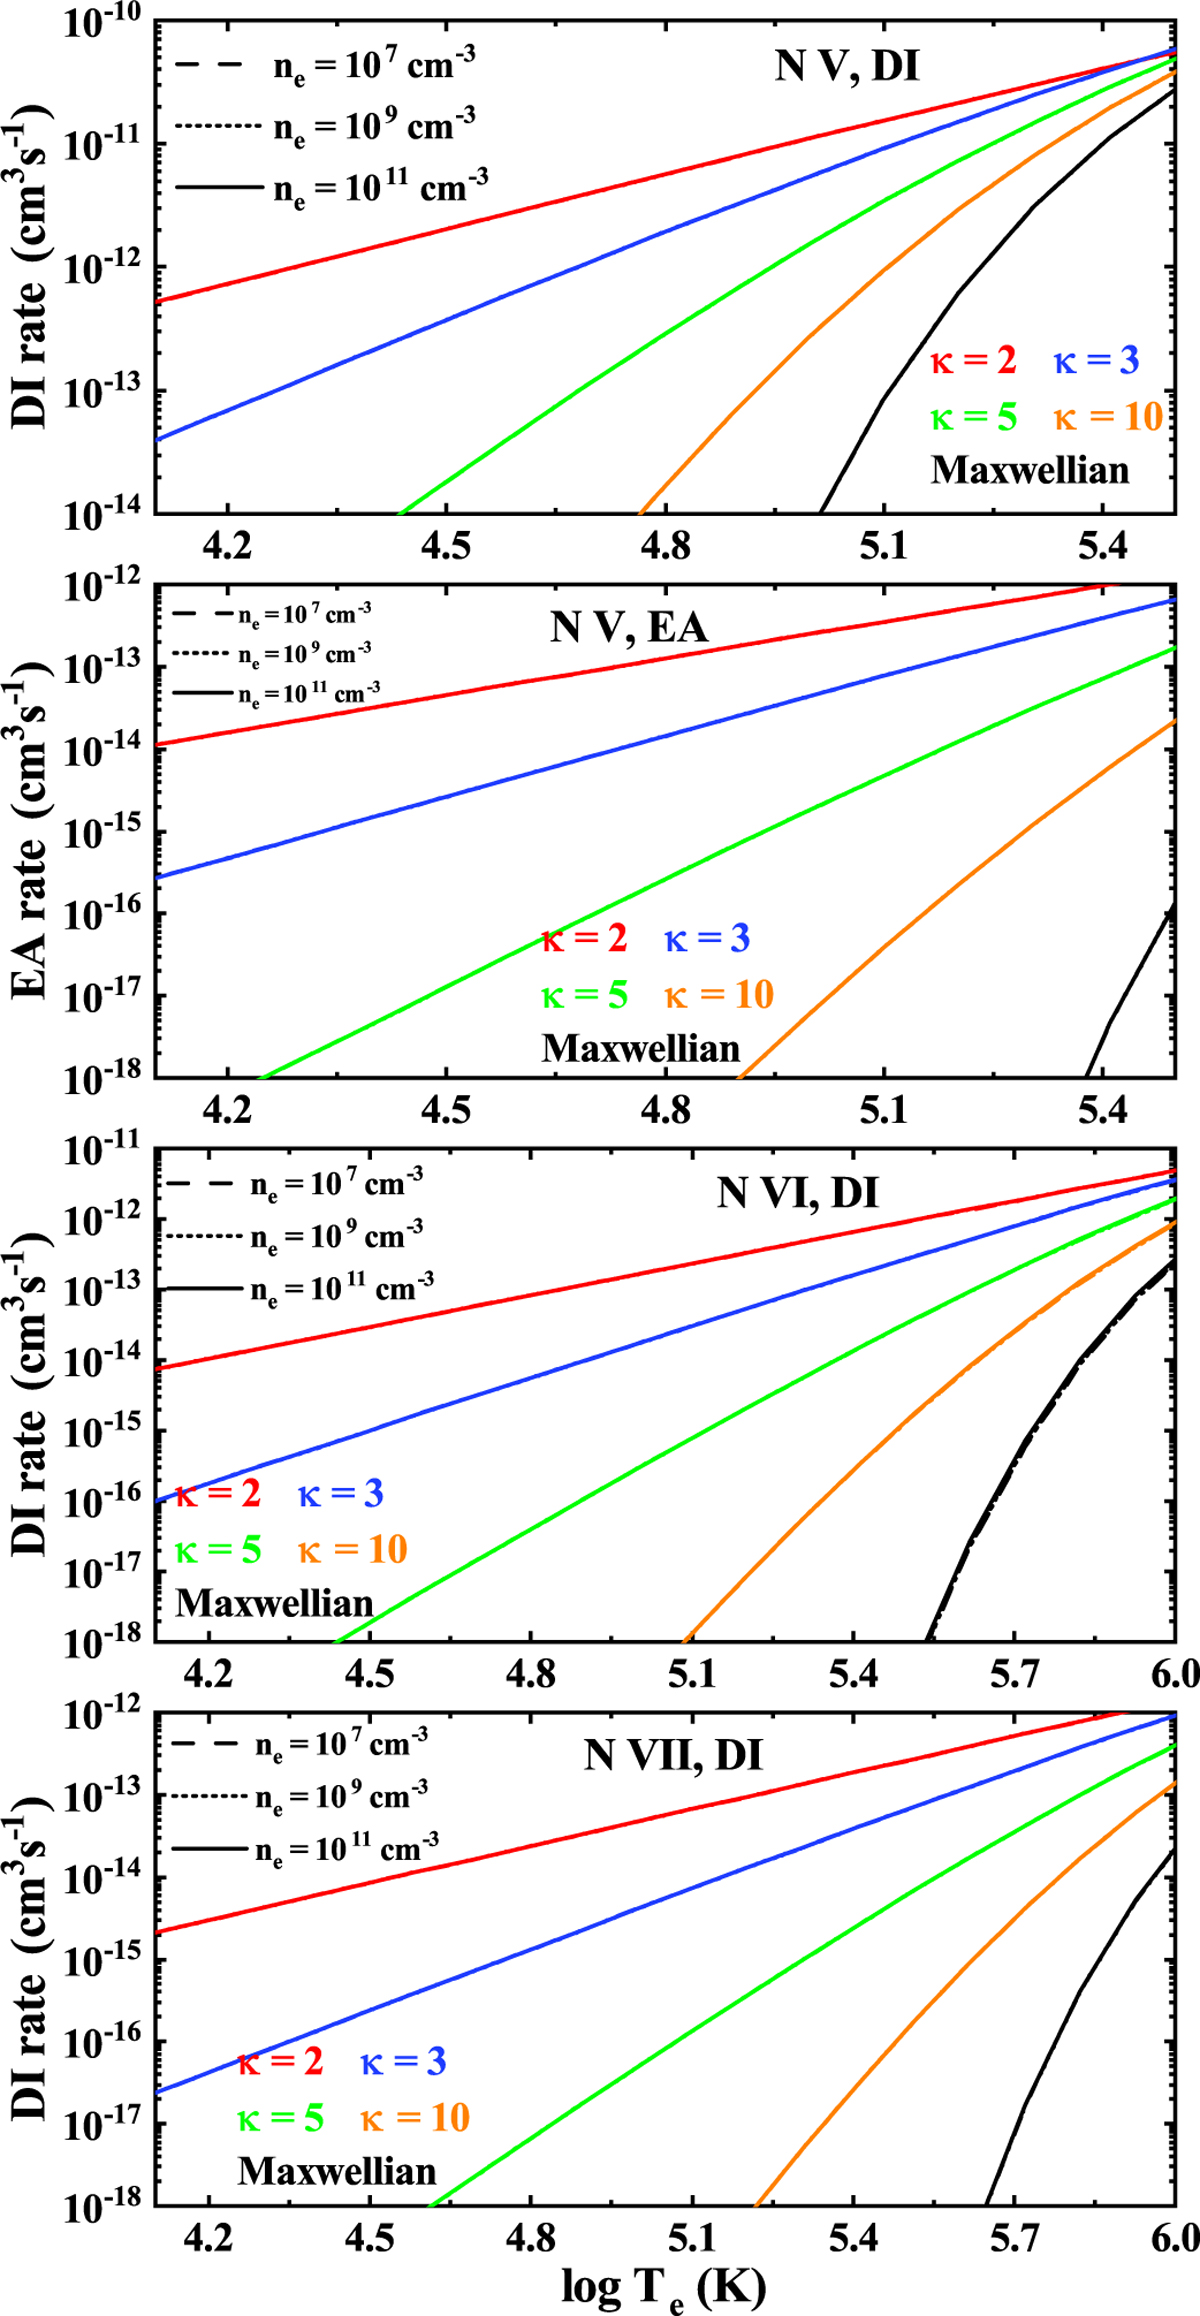
DI and EA rate coefficients of N V, as well as the EA rate coefficients of N VI and N VII. Different colors correspond to different energy distributions, and the different line shapes represent different electron densities.
Current usage metrics show cumulative count of Article Views (full-text article views including HTML views, PDF and ePub downloads, according to the available data) and Abstracts Views on Vision4Press platform.
Data correspond to usage on the plateform after 2015. The current usage metrics is available 48-96 hours after online publication and is updated daily on week days.
Initial download of the metrics may take a while.