Fig. 1.
Download original image
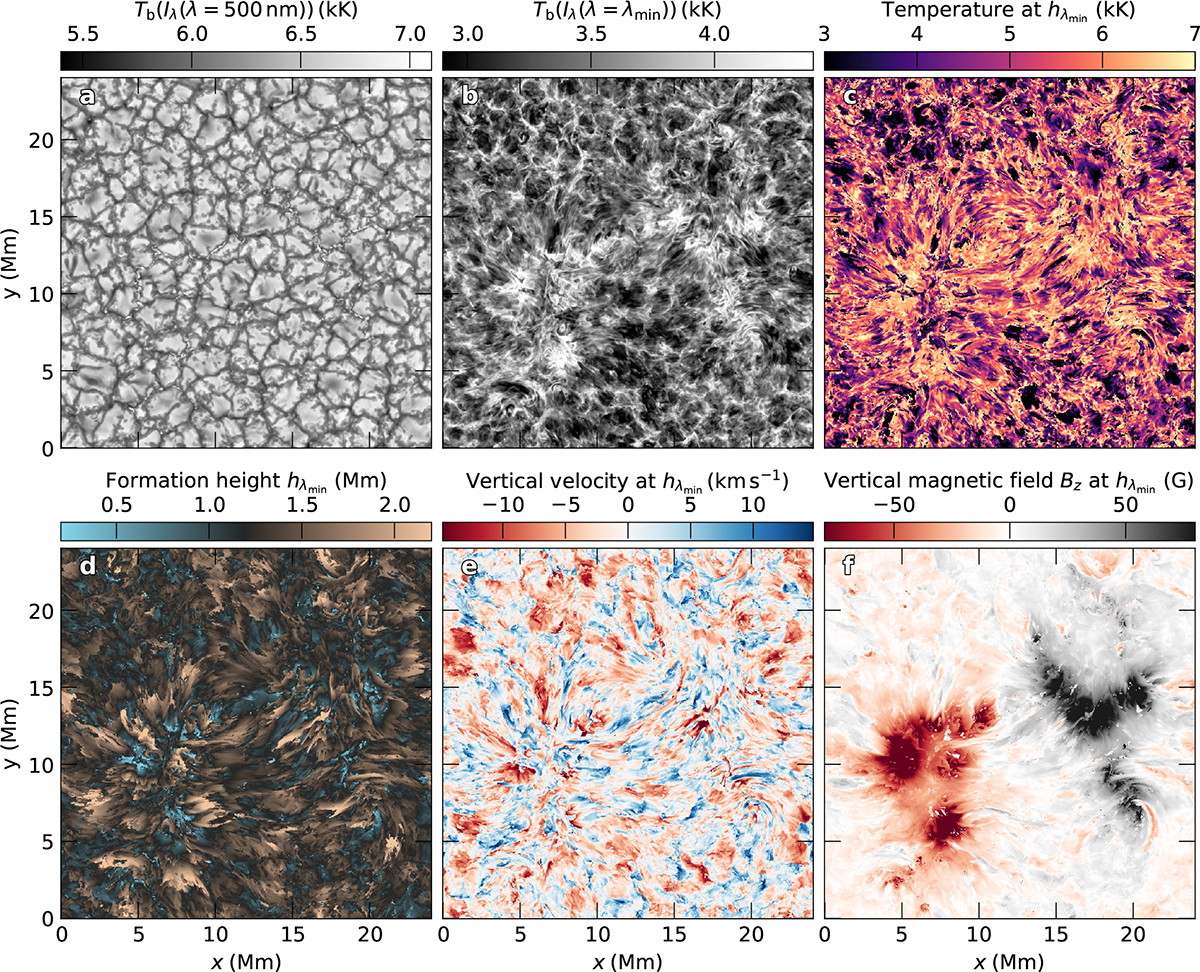
Overview of intensity and atmospheric properties at the formation height of the intensity profile minimum. Panel (a): Continuum intensity at λ = 500 nm shown as the brightness temperature. Panel (b): Intensity at the profile minimum (λmin) of the Ca IIλ854.2 nm spectral line shown as the brightness temperature. Panel (c): Temperature at the formation height of the line profile minimum. Panel (d): Formation height of the line profile minimum, hλmin = h(τλ, min = 1). Panel (e): Vertical velocity at hλmin. Panel (f): Vertical component of the magnetic field at hλmin. The line profile minimum and the corresponding formation height are individually determined for each column in the atmosphere. The color scale limits are clipped to increase the contrast of the images (see text). The intensity (panels a and b), as well as the formation heights that were used to create panels (c), (d), (e), and (f), originate from the IM RT computation from the snapshot muram_en_518000_503s.
Current usage metrics show cumulative count of Article Views (full-text article views including HTML views, PDF and ePub downloads, according to the available data) and Abstracts Views on Vision4Press platform.
Data correspond to usage on the plateform after 2015. The current usage metrics is available 48-96 hours after online publication and is updated daily on week days.
Initial download of the metrics may take a while.