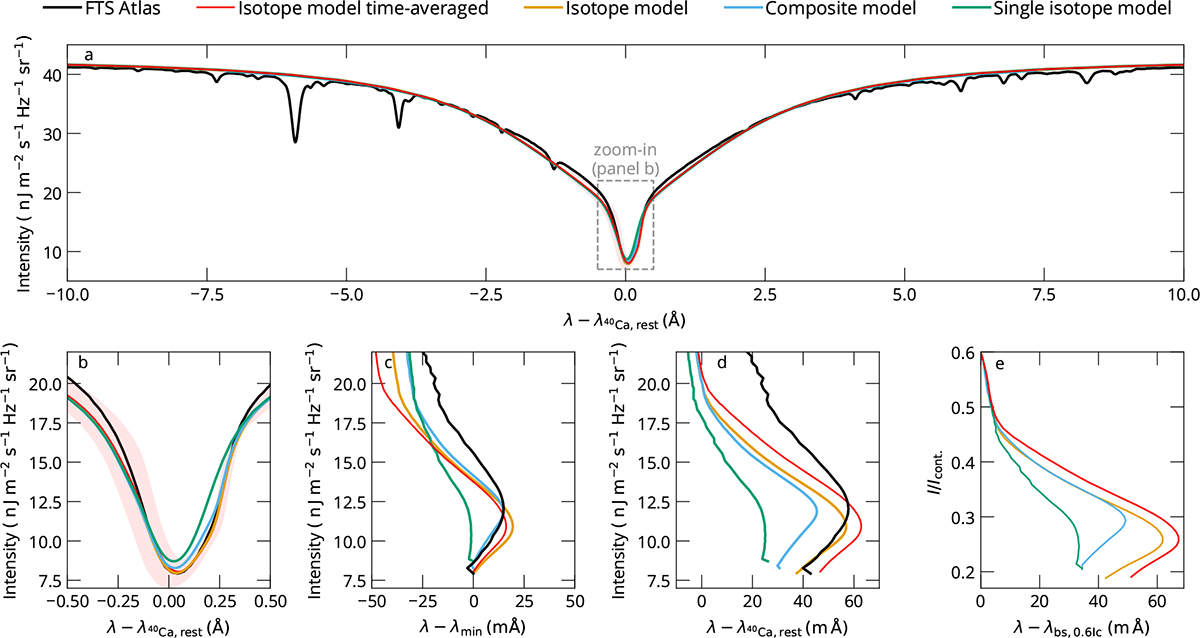
Fig. 2.
Download original image
Comparison of spatially averaged profiles (panels a and b) and corresponding bisectors (panels c, d, and e) of the Ca IIλ854.2 nm line. The black curves show spatially averaged QS spectra from the Hamburg FTS atlas. The red curve shows a time average of the full isotope computation of four snapshots separated by 2 min (see Appendix A for more details) together with the standard deviation multiplied by a factor of eight, in light red (visible in panel b but not in panel a). The orange, green, and blue curves show data from the single snapshot muram_en_518000_503s. In orange, we show the spatially averaged synthetic spectra computed by taking all isotopes of calcium into account. The other curves show similar profiles but computed without isotopic splitting (green), and using a composite model atom (blue). The wavelength axis of the average profiles is centered at λ − λ40Ca, rest, where λ40Ca, rest is the rest wavelength of 40Ca, the most abundant calcium isotope. The bisectors are presented in three different ways: all centered on the wavelength of the corresponding line profile minimum (panel c), shown on an absolute wavelength scale (panel d), and centered on the wavelength where the bisector intensity is 60% of the continuum intensity (panel e).
Current usage metrics show cumulative count of Article Views (full-text article views including HTML views, PDF and ePub downloads, according to the available data) and Abstracts Views on Vision4Press platform.
Data correspond to usage on the plateform after 2015. The current usage metrics is available 48-96 hours after online publication and is updated daily on week days.
Initial download of the metrics may take a while.