Fig. 3.
Download original image
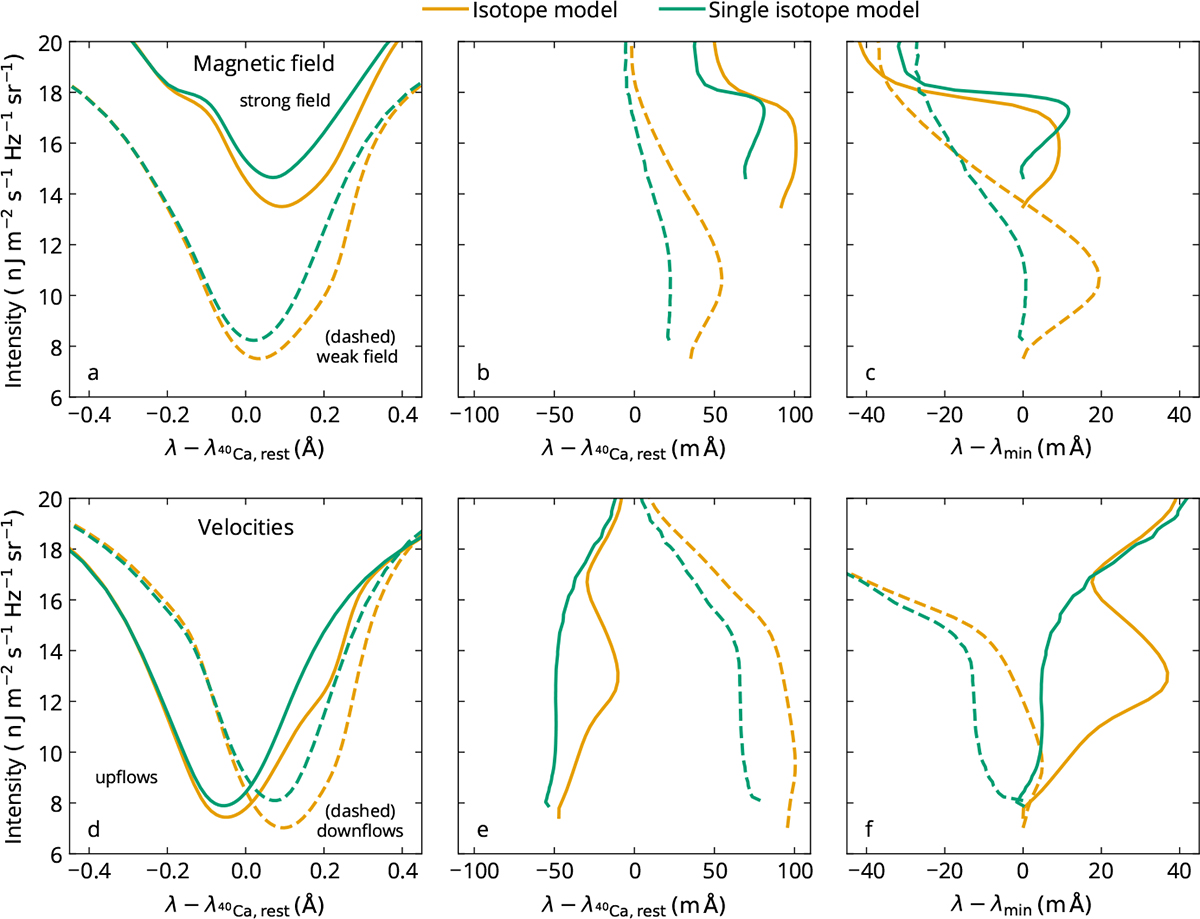
Profiles and bisectors averaged over pixels with similar atmospheric properties. We show data from synthetic spectra taking all isotopes into account (orange) and taking only the most abundant isotope (green) into account. Top row (panels a, b, and c): Results computed from a selection of strong (solid lines) and weak (dashed lines) magnetic fields in the formation height region of the line core (see text for details). Bottom row (panels d, e, and f): Only profiles and bisectors over the pixels harboring upflows (solid lines) or downflows (dashed lines) in the formation height region of the line core (see text). The bisectors are shown on an absolute wavelength scale (panels b and e) and on a scale where the bisectors are centered on the line profile minimum wavelength (λmin). The synthetic data correspond to snapshot muram_en_518000_503s.
Current usage metrics show cumulative count of Article Views (full-text article views including HTML views, PDF and ePub downloads, according to the available data) and Abstracts Views on Vision4Press platform.
Data correspond to usage on the plateform after 2015. The current usage metrics is available 48-96 hours after online publication and is updated daily on week days.
Initial download of the metrics may take a while.