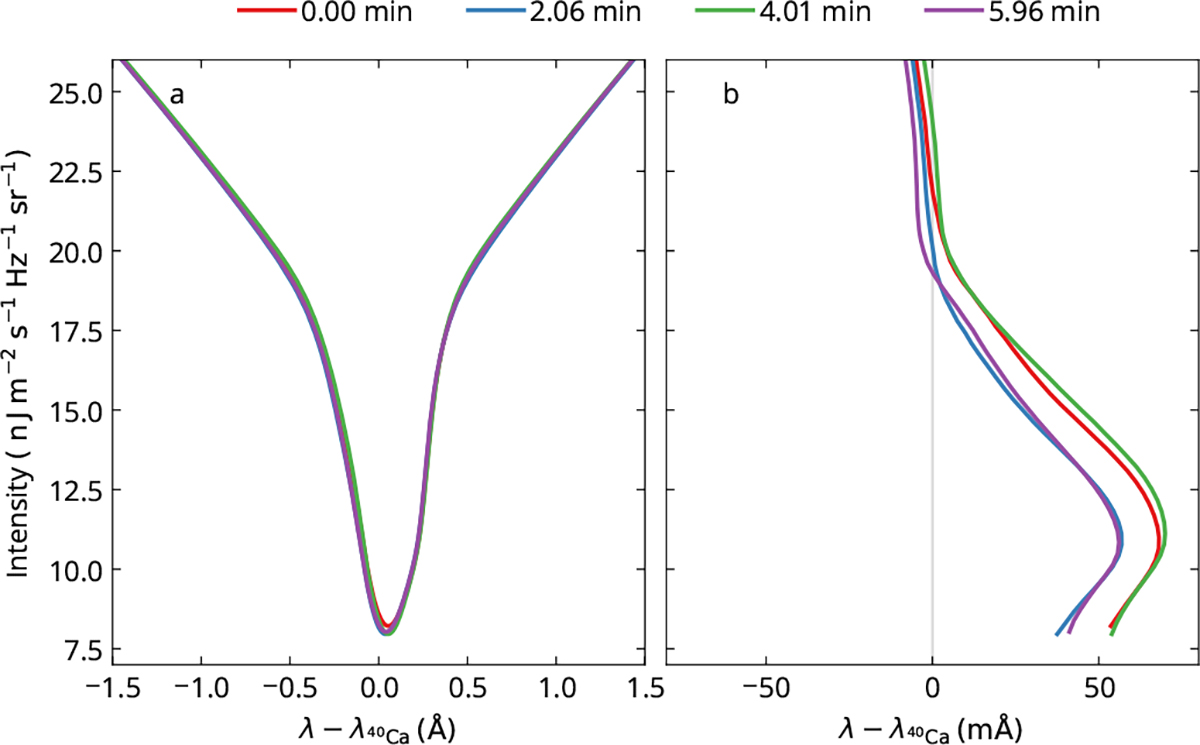
Fig. A.1.
Download original image
Time variation of the spatially averaged line profile in the simulation. We show the spatially averaged line profiles (panel a) and their bisectors (panel b) from four snapshots of the simulation that are averaged by approximately 2 min of simulation time. The snapshot at t = 2.06 min (blue curves) corresponds to the snapshot muram_en_518000_503s, which is discussed in detail in the main text. The line profiles are presented in a large wavelength window to show that there is also a time variation in the far wings of the spectral line in the simulation. The bisectors in panel (b) are shown on an absolute wavelength scale, similar to Fig. 2d. All the synthetic profiles in this figure were computed including isotopes and thus correspond to IM computations.
Current usage metrics show cumulative count of Article Views (full-text article views including HTML views, PDF and ePub downloads, according to the available data) and Abstracts Views on Vision4Press platform.
Data correspond to usage on the plateform after 2015. The current usage metrics is available 48-96 hours after online publication and is updated daily on week days.
Initial download of the metrics may take a while.