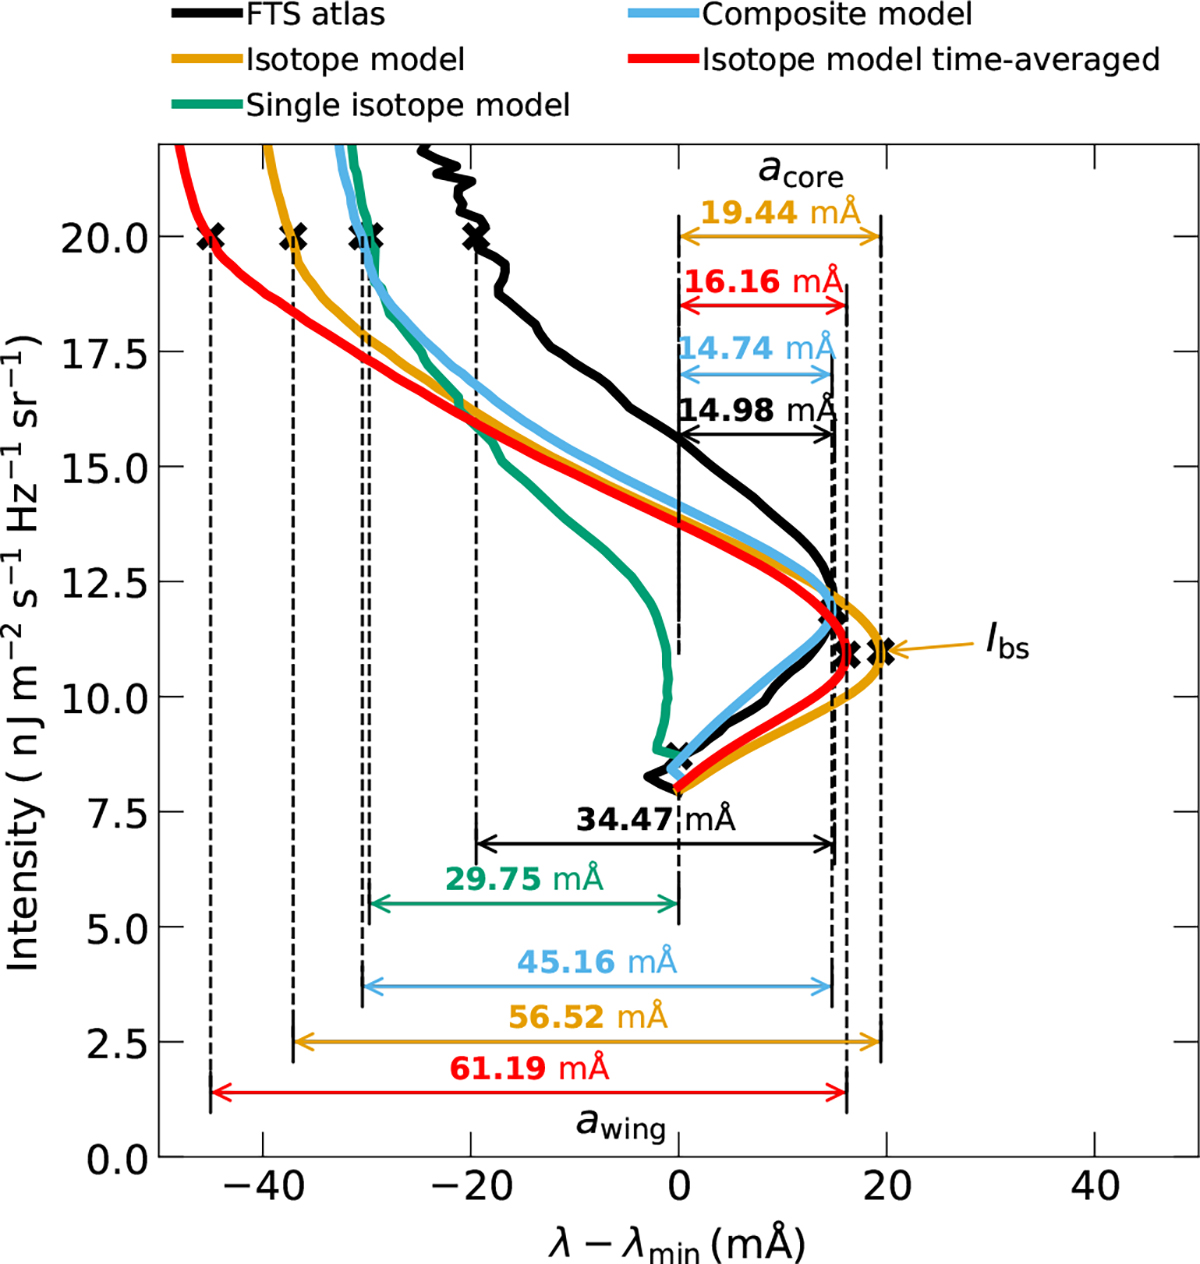
Fig. B.2.
Download original image
Determination of line bisector parameters. Shown are the line bisectors for the spatially averaged line profiles for the observation (black), the IM computation (orange), the CM computation (blue), the SIM computation (green), and the temporal average of four snapshots computed with the IM treatment (red). The core amplitude of the bisector (acore) is the wavelength difference between the line profile minimum and the red-most excursion of the bisector. The wing amplitude is the wavelength difference between the red-most excursion and the bisector at approximately half the continuum intensity.
Current usage metrics show cumulative count of Article Views (full-text article views including HTML views, PDF and ePub downloads, according to the available data) and Abstracts Views on Vision4Press platform.
Data correspond to usage on the plateform after 2015. The current usage metrics is available 48-96 hours after online publication and is updated daily on week days.
Initial download of the metrics may take a while.