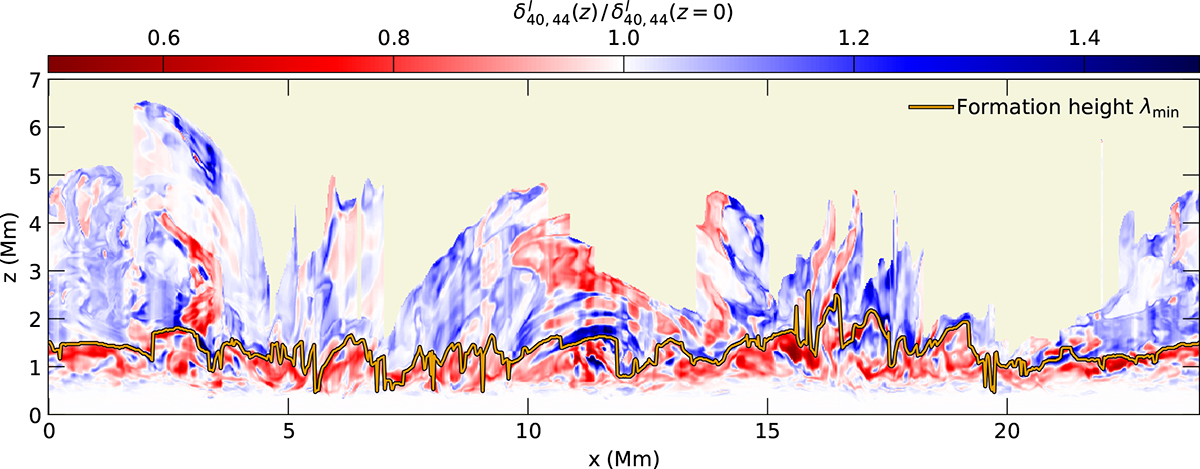
Fig. C.1.
Download original image
Validity of the composite atom model. We show the population level ratio of the lower energy state of the Ca IIλ854.2 nm transition between 40Ca and 44Ca normalized by the ratio at z = 0 (see text). 40Ca and 44Ca are the two most abundant Ca isotopes. The orange curve indicates the formation height of the intensity minimum of the Ca IIλ854.2 nm line. The shown data are from the IM computation of snapshotmuram_en_499000_379s. The light yellow background indicates where no data are plotted.
Current usage metrics show cumulative count of Article Views (full-text article views including HTML views, PDF and ePub downloads, according to the available data) and Abstracts Views on Vision4Press platform.
Data correspond to usage on the plateform after 2015. The current usage metrics is available 48-96 hours after online publication and is updated daily on week days.
Initial download of the metrics may take a while.