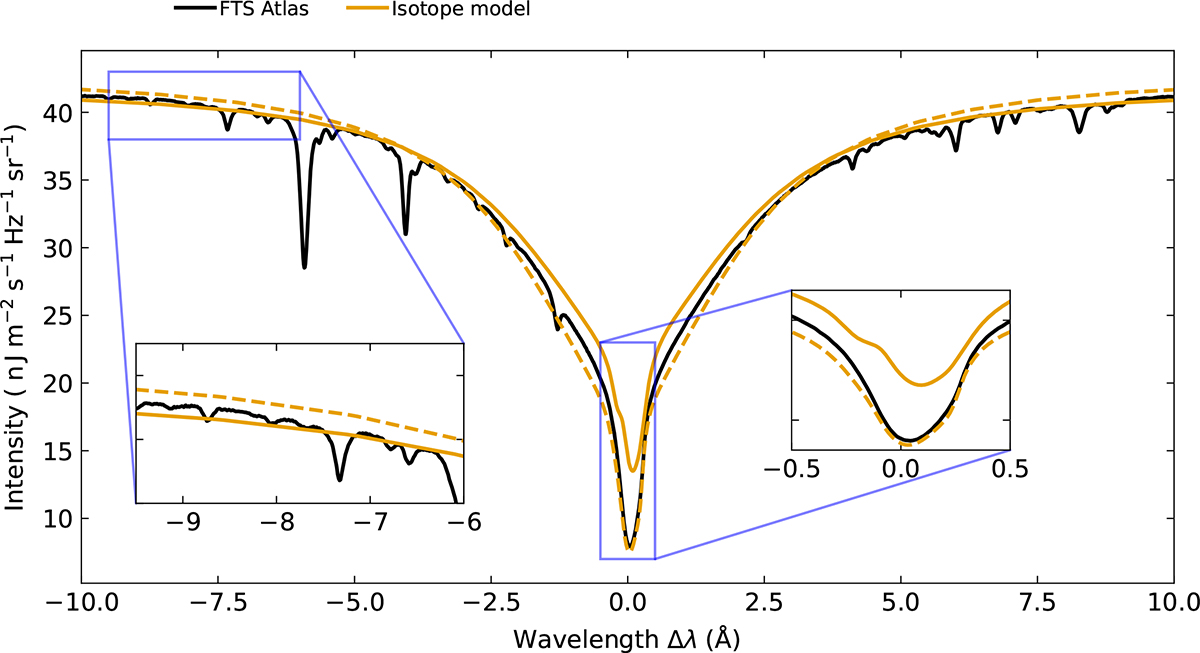
Fig. D.1.
Download original image
Ca IIλ854.2 nm line averaged over regions of different vertical magnetic fields. The layout is similar to Fig. 3a but shows a larger wavelength range, which also includes the continuum. The black line shows the observed data from the Hamburg FTS atlas. The dashed orange line indicates the line profile of the IM computation averaged over regions that have |Bz|avg < 60 G, and the solid orange line the IM computation averaged over regions that have |Bz|avg ≥ 60 G (see Sect. 3.4). For simplicity, we show only the data for the IM computation. The insets show zoomed-in views of the continuum and the line core; the latter is similar to Fig. 3a.
Current usage metrics show cumulative count of Article Views (full-text article views including HTML views, PDF and ePub downloads, according to the available data) and Abstracts Views on Vision4Press platform.
Data correspond to usage on the plateform after 2015. The current usage metrics is available 48-96 hours after online publication and is updated daily on week days.
Initial download of the metrics may take a while.