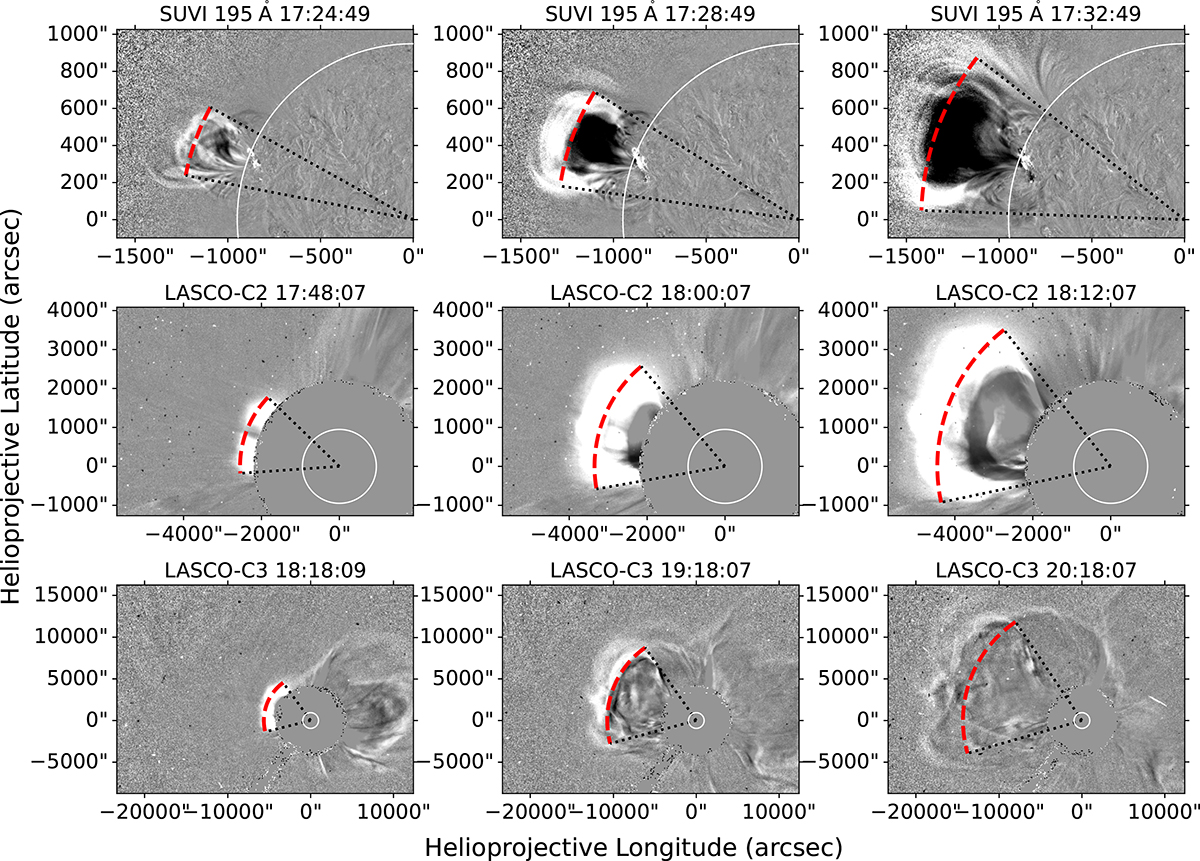
Fig. 1.
Download original image
Running-ratio images showing the progression of the CME at the eastern limb from SUVI (top panel), LASCO C2 (middle panel), and LASCO C3 (bottom panel). The arc shape is used to estimate the CME expansion speed and angular width. The black dots represent the upper and lower slits, while the red dashes represent the triangle base, denoting the CME’s width.
Current usage metrics show cumulative count of Article Views (full-text article views including HTML views, PDF and ePub downloads, according to the available data) and Abstracts Views on Vision4Press platform.
Data correspond to usage on the plateform after 2015. The current usage metrics is available 48-96 hours after online publication and is updated daily on week days.
Initial download of the metrics may take a while.