Fig. A.6.
Download original image
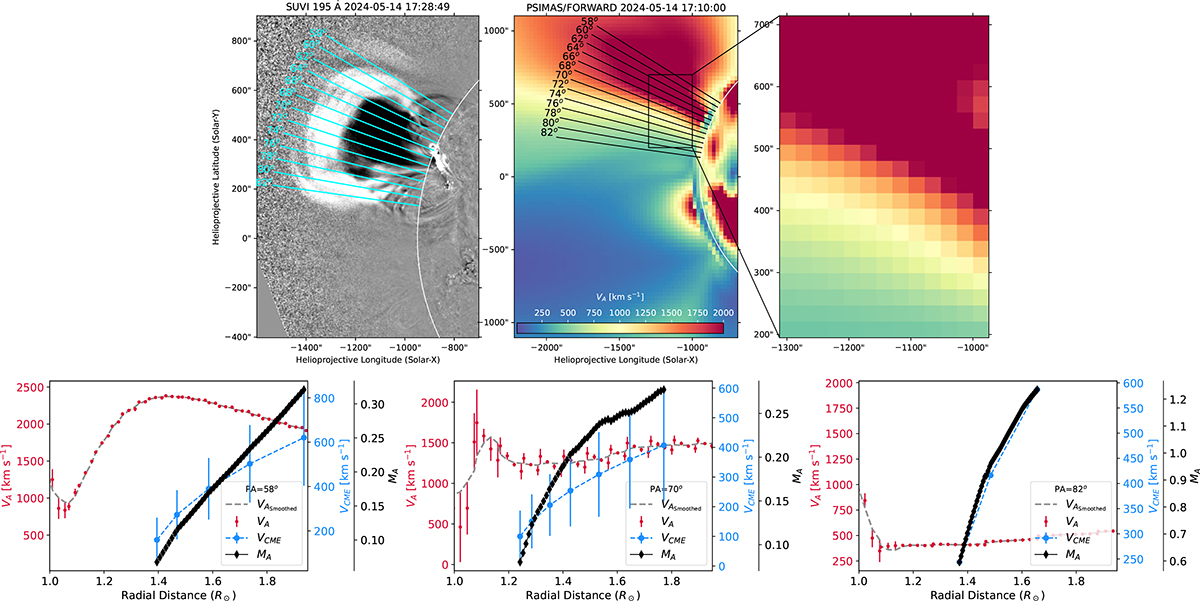
Top panel: SUVI running-ratio image and the pre-eruption Alfvén speed map from the PSI-MAS FORWARD model, with the radial slits. The zoomed-in view at the centre of the eruption location shows the differences between the north and south of the AR clearly, as well as the pixelation. The Alfvén speed profiles are jagged due to the pixelation. Bottom panel: Temporal evolution for the CME speed, the Alfvén speed, and the Mach number for the upper, middle, and lower slits. The Mach number is estimated by dividing the CME speed by the Alfvén speed after they are interpolated to match their lengths.
Current usage metrics show cumulative count of Article Views (full-text article views including HTML views, PDF and ePub downloads, according to the available data) and Abstracts Views on Vision4Press platform.
Data correspond to usage on the plateform after 2015. The current usage metrics is available 48-96 hours after online publication and is updated daily on week days.
Initial download of the metrics may take a while.