Open Access
Fig. 2.
Download original image
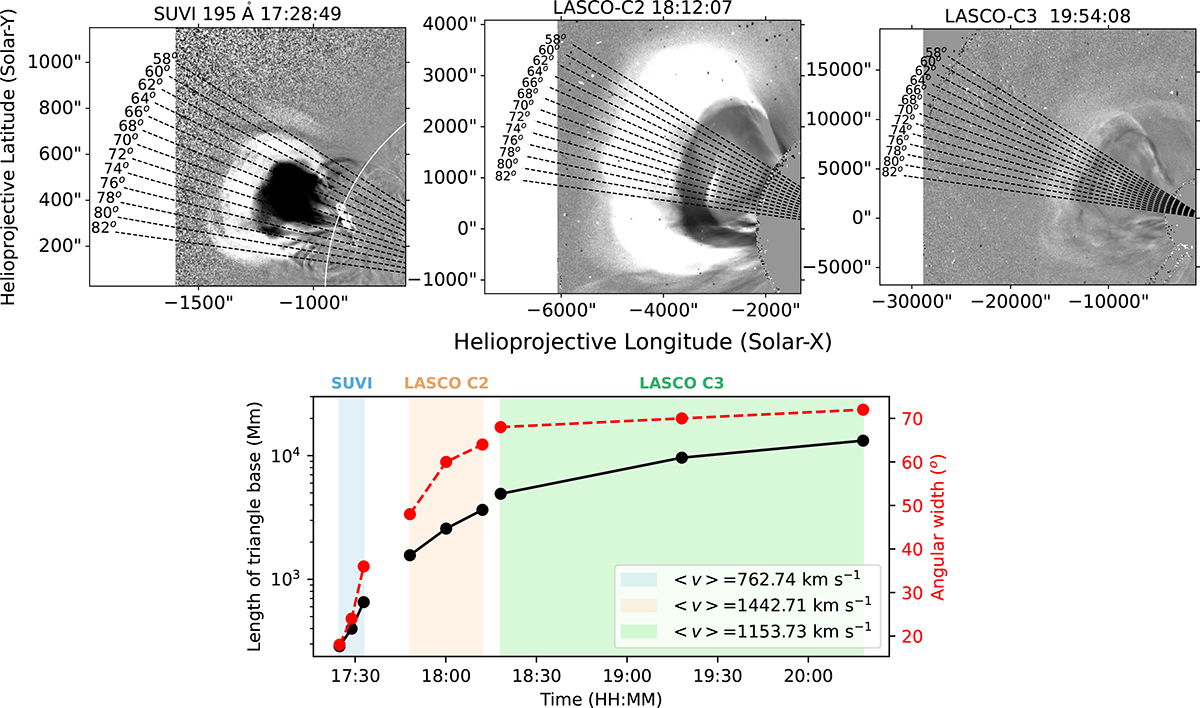
Top panel: Running ratio images showing the EUV wave, as observed by SUVI and LASCO C2 and C3, with the slits defined as position angles. Bottom panel: Temporal evolution of the CME angular width and the triangle’s base, determined by the CME’s widest sector in Fig. 1’s frames.
Current usage metrics show cumulative count of Article Views (full-text article views including HTML views, PDF and ePub downloads, according to the available data) and Abstracts Views on Vision4Press platform.
Data correspond to usage on the plateform after 2015. The current usage metrics is available 48-96 hours after online publication and is updated daily on week days.
Initial download of the metrics may take a while.