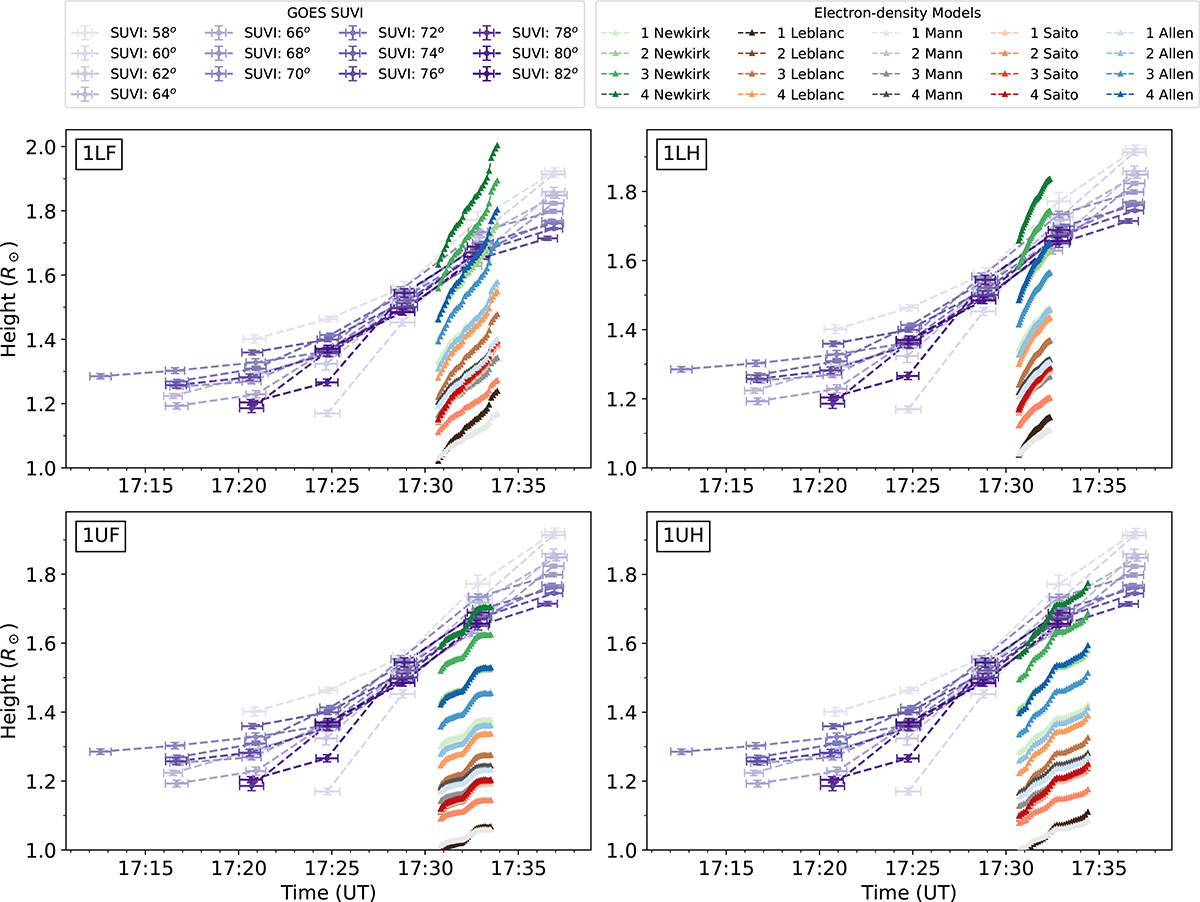
Fig. 4.
Download original image
Height-time profile for the coronal wave from SUVI along the slits shown in Fig. 2 and the first type II burst from I−LOFAR, showing different electron density models with a scaling factor from 1 to 4. Left: F lanes. Right: H lanes. Top: Lower lanes. Bottom: Upper lanes. The height-time profiles for the rest of the lanes of type II bursts are listed in Appendix A.
Current usage metrics show cumulative count of Article Views (full-text article views including HTML views, PDF and ePub downloads, according to the available data) and Abstracts Views on Vision4Press platform.
Data correspond to usage on the plateform after 2015. The current usage metrics is available 48-96 hours after online publication and is updated daily on week days.
Initial download of the metrics may take a while.