Fig. 6.
Download original image
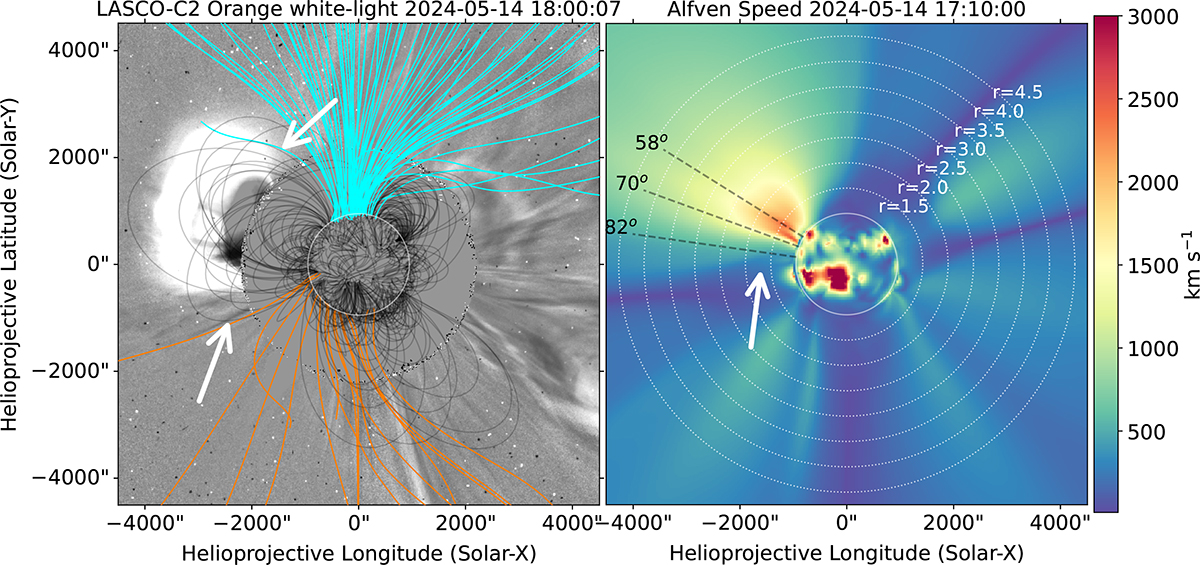
Left: Running ratio image showing the PFSS model on top of the EUV wave in LASCO C2. The cyan and orange lines represent north and south magnetic polarities, respectively. Meanwhile, the black lines represent closed field lines. For better contrast, we used black colours for the closed field lines in the LASCO C2 image. Right: FORWARD maps showing pre-eruption coronal conditions at 17:10 UT. The white circle denotes the solar limb, the same FOV as LASCO C2, with dotted circles representing different radial distances in solar radii. The white arrow points towards the boundary between the CME bottom flank and the streamer where a low Alfvén speed exists, which provides good conditions for shock formation and hence type II radio emissions.
Current usage metrics show cumulative count of Article Views (full-text article views including HTML views, PDF and ePub downloads, according to the available data) and Abstracts Views on Vision4Press platform.
Data correspond to usage on the plateform after 2015. The current usage metrics is available 48-96 hours after online publication and is updated daily on week days.
Initial download of the metrics may take a while.