Fig. 1
Download original image
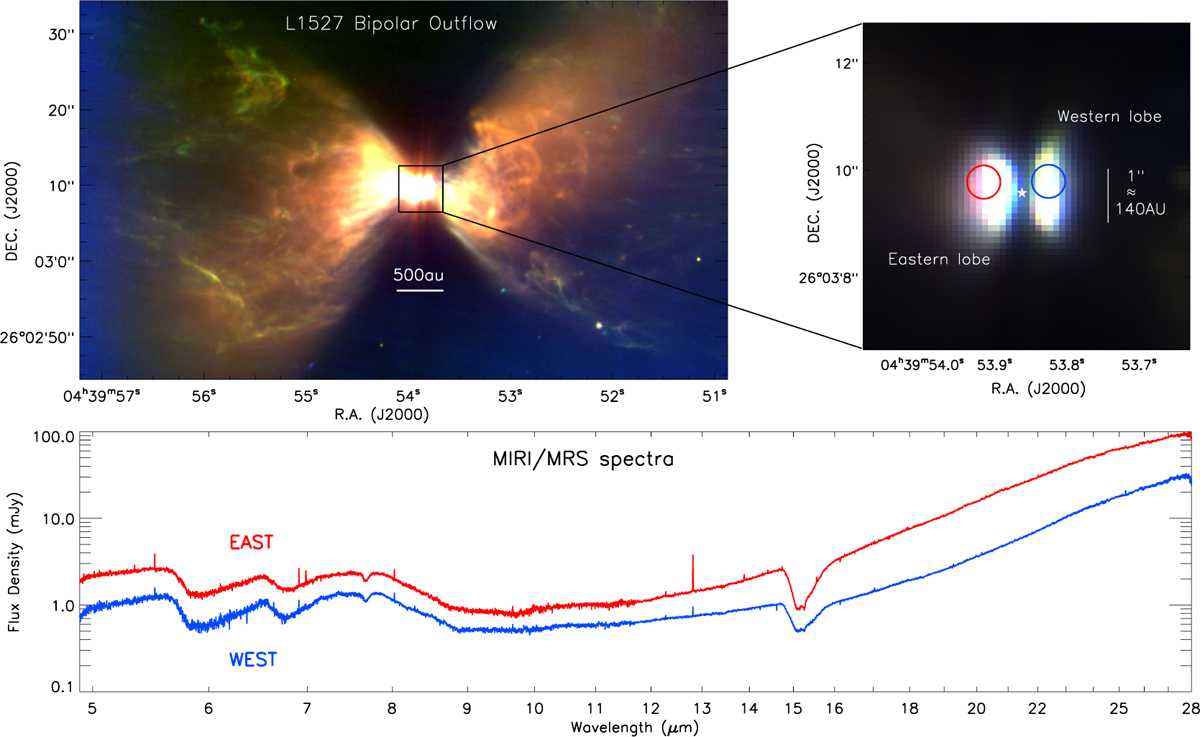
Mid-infrared three-color image of the L1527 bipolar outflow, using JWST MIRI broadband imaging at 5.6 μm (red), 7.7 μm (green), and 12.8 μm (blue). The region spans 1.43′ × 0.83′, corresponding to a physical scale of 12 000 au × 7000 au at a distance of 140pc. The prominent blue emission at the left edge is not physical, but an artifact of color stretch. Right: zoomed-in view of the 500 au central region with brightness scaled to reveal the bipolar outflow lobes. The position of the forming protostar is marked by a star symbol. Two circular apertures of ~0″.3 radius in red and blue correspond to the area where the MIRI/MRS spectra were extracted. Bottom: Spectra obtained at the aperture positions across the full MIRI/MRS wavelength range (5-28 μm). The red-colored spectra correspond to the eastern lobe, whereas the blue spectra correspond to the western lobe. Flux density of both spectra are scaled for visual offset.
Current usage metrics show cumulative count of Article Views (full-text article views including HTML views, PDF and ePub downloads, according to the available data) and Abstracts Views on Vision4Press platform.
Data correspond to usage on the plateform after 2015. The current usage metrics is available 48-96 hours after online publication and is updated daily on week days.
Initial download of the metrics may take a while.