Fig. 11
Download original image
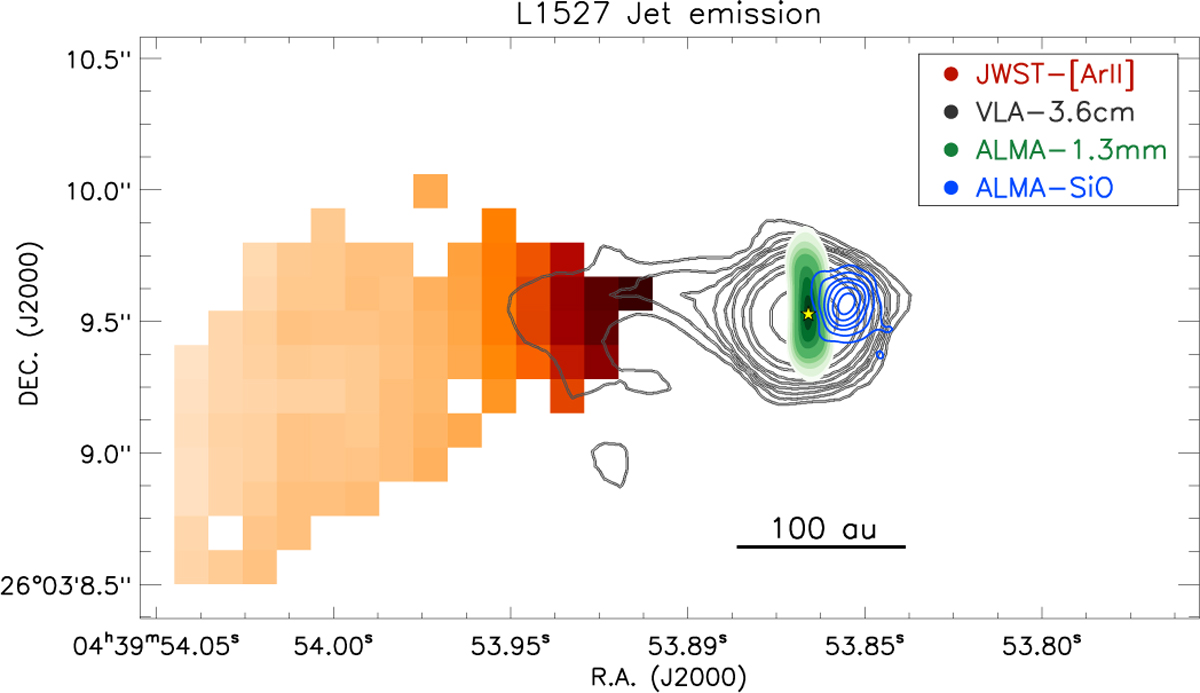
Complete map of jet emission in L1527. The red color shows the JWST [Ar II] HV component jet emission. The black contours show the VLA 3.6 cm thermal emission (Reipurth et al. 2004). The green color shows the ALMA 1.3 mm disk emission. The blue contours show the ALMA SiO jet emission (van’t Hoff et al. 2023). The position of the central star is shown with a star.
Current usage metrics show cumulative count of Article Views (full-text article views including HTML views, PDF and ePub downloads, according to the available data) and Abstracts Views on Vision4Press platform.
Data correspond to usage on the plateform after 2015. The current usage metrics is available 48-96 hours after online publication and is updated daily on week days.
Initial download of the metrics may take a while.