Fig. B.1
Download original image
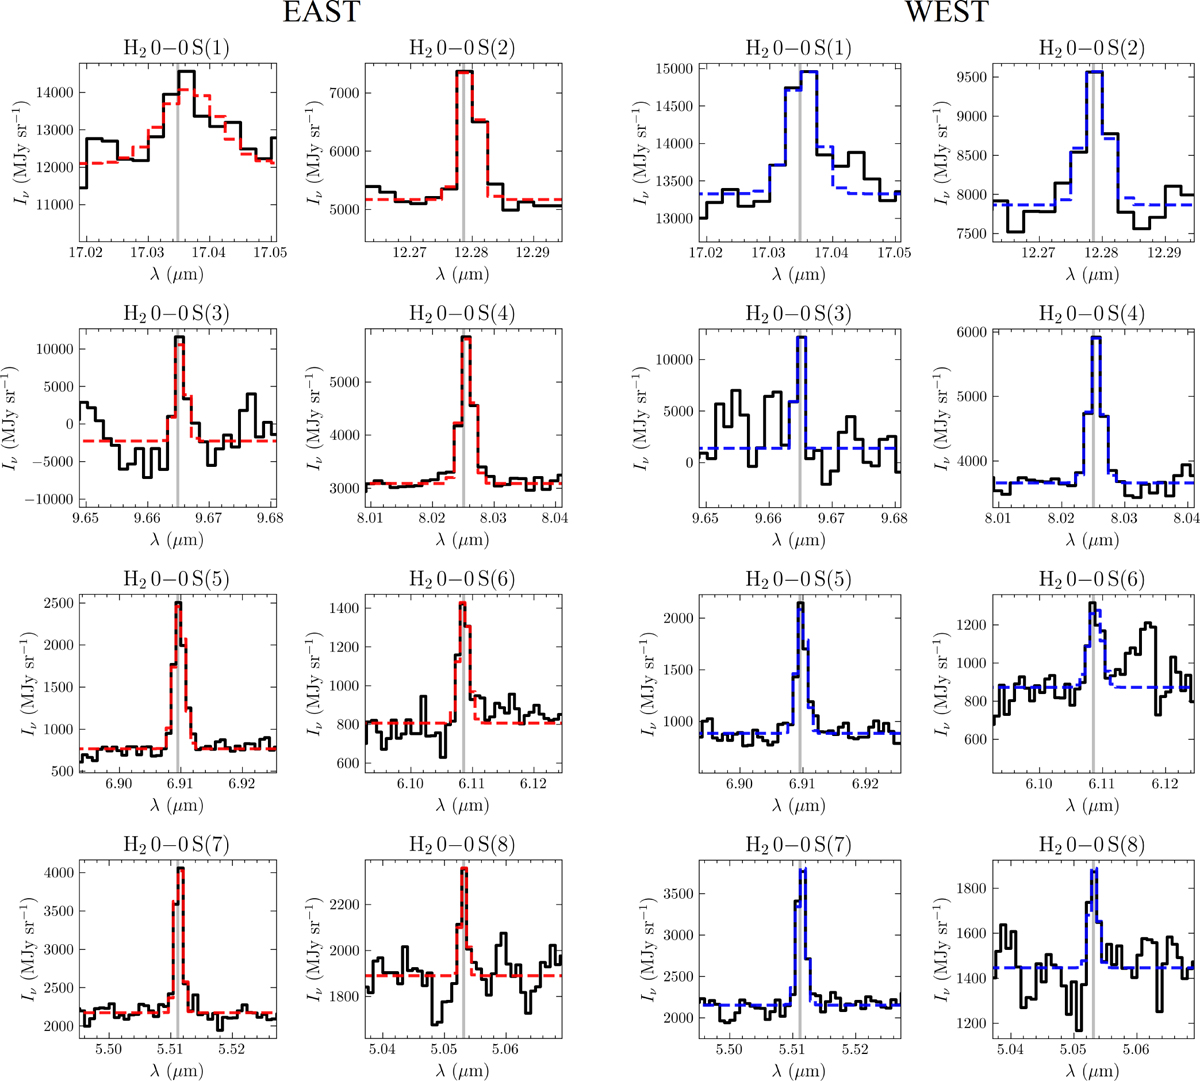
Extinction-corrected H2 rotational lines from S(1) to S(8) transitions for example spaxels at aperture positions in the eastern and western lobes (see Fig. 1). The Gaussian fits to the lines are color-coded in red and blue, respectively, for each region. The vertical gray line indicates the central wavelength of each transition.
Current usage metrics show cumulative count of Article Views (full-text article views including HTML views, PDF and ePub downloads, according to the available data) and Abstracts Views on Vision4Press platform.
Data correspond to usage on the plateform after 2015. The current usage metrics is available 48-96 hours after online publication and is updated daily on week days.
Initial download of the metrics may take a while.