Fig. B.3
Download original image
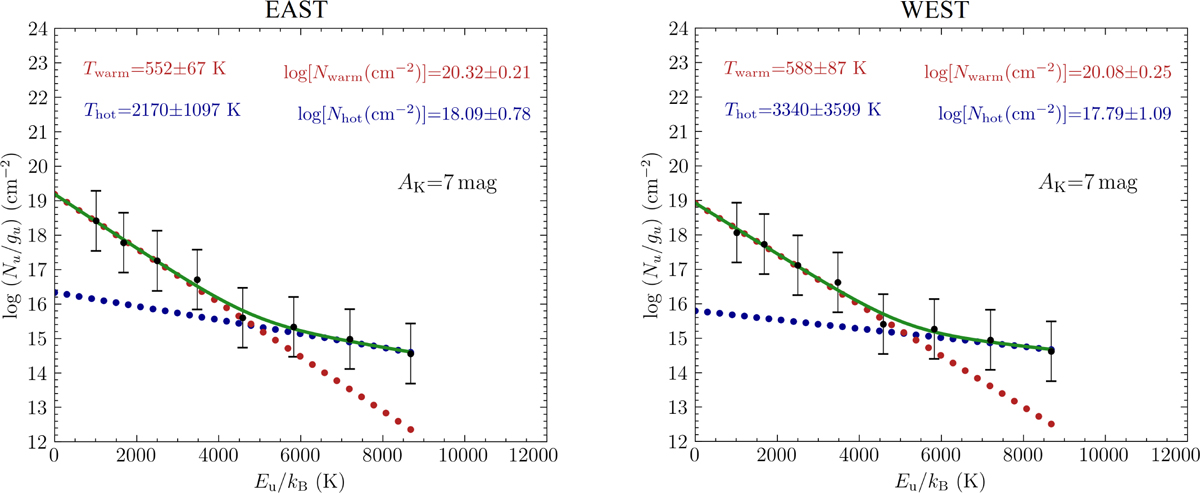
H2 excitation diagram analysis using pdrtpy for example spaxels at aperture positions in the eastern and western lobes (see Fig. 1). Extinction-corrected line intensities, converted to upper-state column densities, are shown as black data points with error bars. The two-component fit to the data points is shown by red and blue dots, for the warm and hot component, respectively. The total fit is indicated by a green line. Estimated temperature and column density values are shown at the top. The errors bars are estimated from uncertainties in the line-integrated intensities, absolute flux calibration (5%), and extinction (2 mag). These uncertainties are then propagated to the upper-state column densities.
Current usage metrics show cumulative count of Article Views (full-text article views including HTML views, PDF and ePub downloads, according to the available data) and Abstracts Views on Vision4Press platform.
Data correspond to usage on the plateform after 2015. The current usage metrics is available 48-96 hours after online publication and is updated daily on week days.
Initial download of the metrics may take a while.