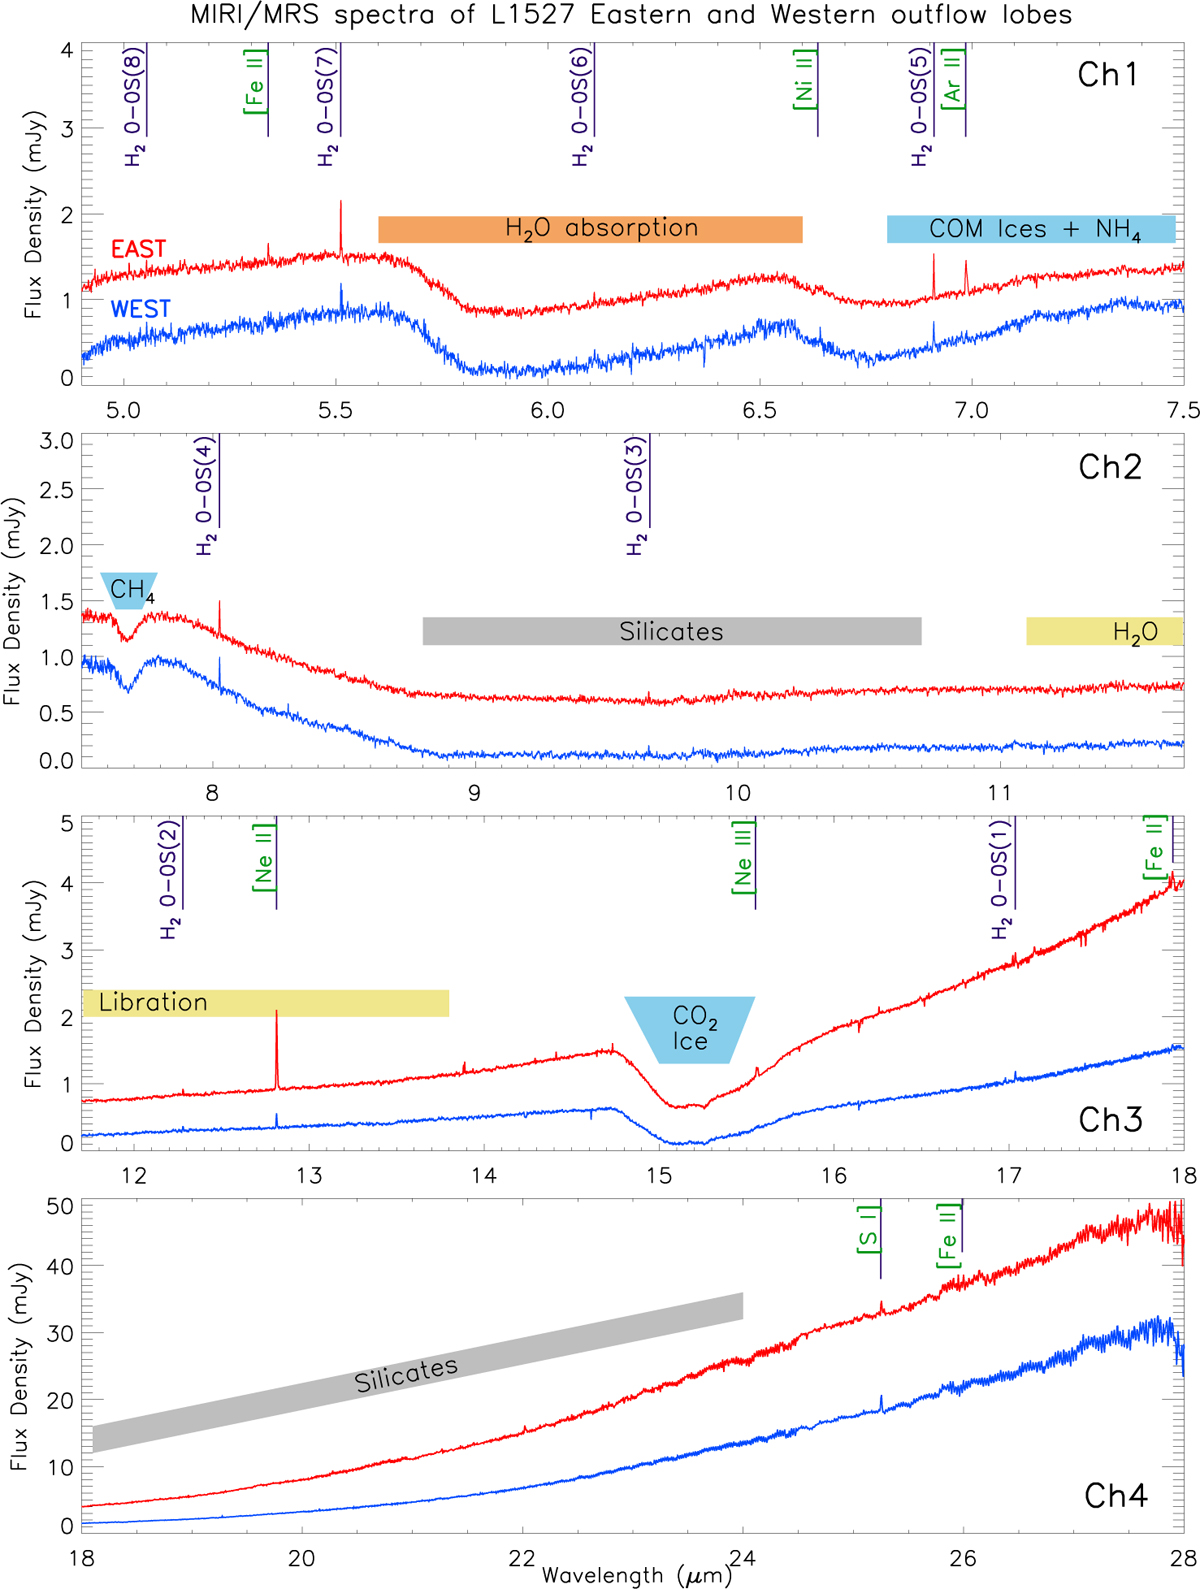
Fig. 2
Download original image
Detailed MIRI/MRS spectra extracted at the aperture positions shown in Fig. 1. The four different panels correspond to the spectra from the four MIRI channels. Various molecular and ionized emission lines are identified and labeled. Major solid-state absorption features from ices and silicates are indicated by wide colored bands. The red spectra are scaled with increased offsets to avoid overlap with the blue spectra.
Current usage metrics show cumulative count of Article Views (full-text article views including HTML views, PDF and ePub downloads, according to the available data) and Abstracts Views on Vision4Press platform.
Data correspond to usage on the plateform after 2015. The current usage metrics is available 48-96 hours after online publication and is updated daily on week days.
Initial download of the metrics may take a while.