Fig. 3
Download original image
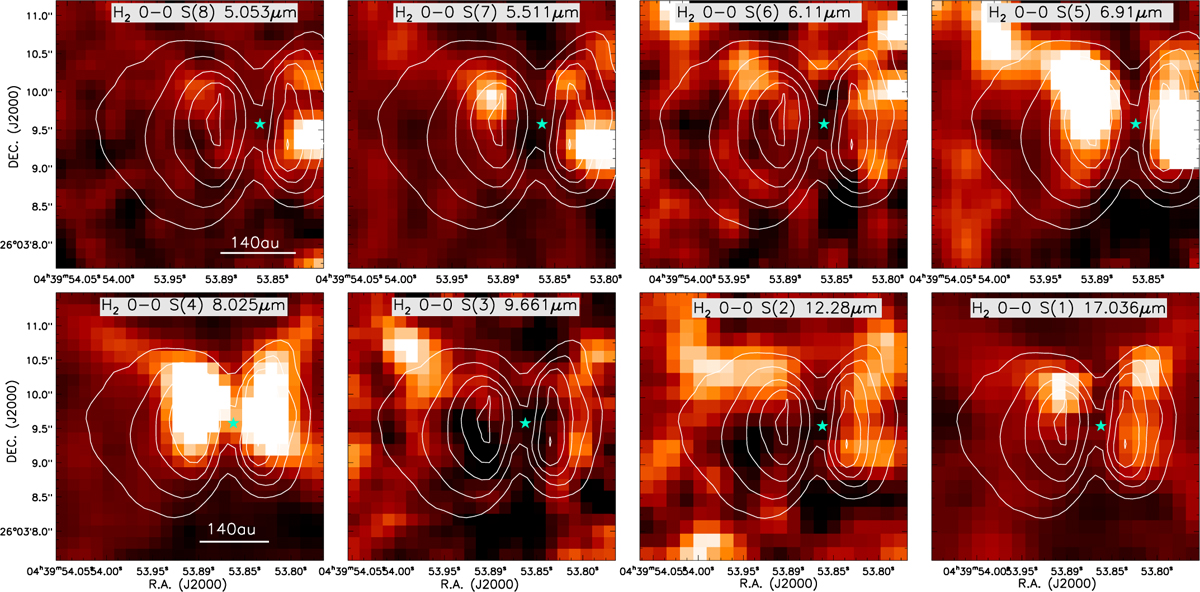
Line-integrated intensity (moment 0) maps of molecular H2 0-0 rotational transitions from S(8) to S(1) covering 5-28 μm range. The upperstate excitation energies for H2 decrease from S(8) to S(1) transitions (see Table A.1). The maps were created after subtracting the local continuum. The brightest regions correspond to the strongest H2 emission. The white contours represent the 5.6 μm broadband emission. The position of the central star is marked with a star.
Current usage metrics show cumulative count of Article Views (full-text article views including HTML views, PDF and ePub downloads, according to the available data) and Abstracts Views on Vision4Press platform.
Data correspond to usage on the plateform after 2015. The current usage metrics is available 48-96 hours after online publication and is updated daily on week days.
Initial download of the metrics may take a while.