Fig. 4
Download original image
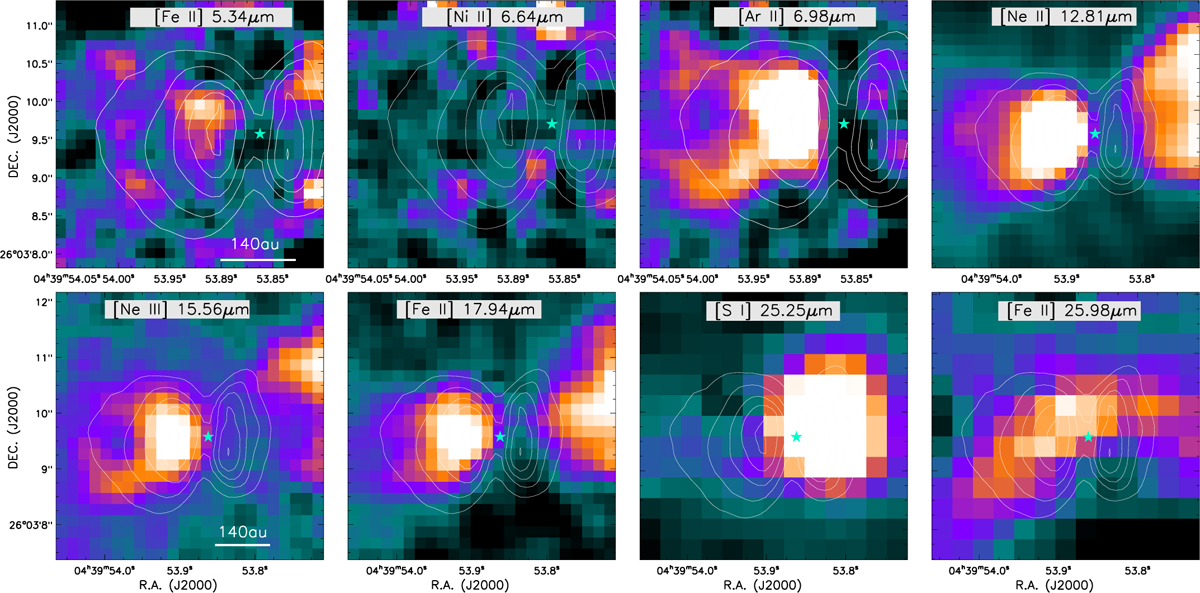
Line-integrated intensity (moment 0) maps of atomic and ionized emission lines in L1527. The maps cover all the lines detected in the MIRI spectral range and were created after subtracting the local continuum. The brightest white-orange regions correspond to the strongest line emission in each of the species. The white contours represent the 5.6 μm broadband emission. The position of the central protostar is marked with a star.
Current usage metrics show cumulative count of Article Views (full-text article views including HTML views, PDF and ePub downloads, according to the available data) and Abstracts Views on Vision4Press platform.
Data correspond to usage on the plateform after 2015. The current usage metrics is available 48-96 hours after online publication and is updated daily on week days.
Initial download of the metrics may take a while.