Fig. 7
Download original image
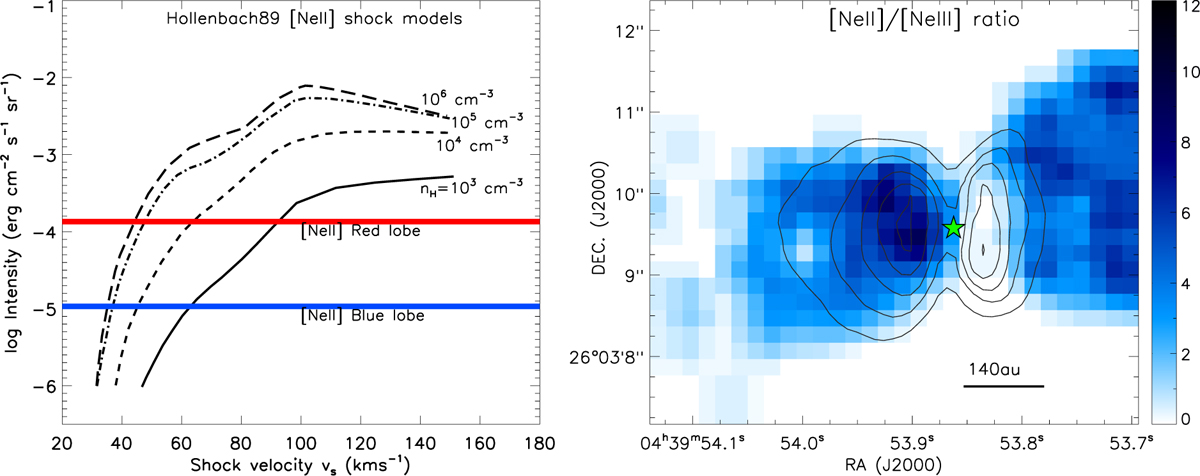
Left: [Ne II] emission compared to the Hollenbach & McKee (1989) J-type shock models with a range of predicted intensities against pre-shock densities and shock velocities. Observed line intensities in red and blue were obtained at aperture positions in the eastern and western lobes (see Table A.2). Right: [NeII]/[NeIII] ratio map obtained from continuum-subtracted and extinction-corrected line intensities.
Current usage metrics show cumulative count of Article Views (full-text article views including HTML views, PDF and ePub downloads, according to the available data) and Abstracts Views on Vision4Press platform.
Data correspond to usage on the plateform after 2015. The current usage metrics is available 48-96 hours after online publication and is updated daily on week days.
Initial download of the metrics may take a while.