Fig. 8
Download original image
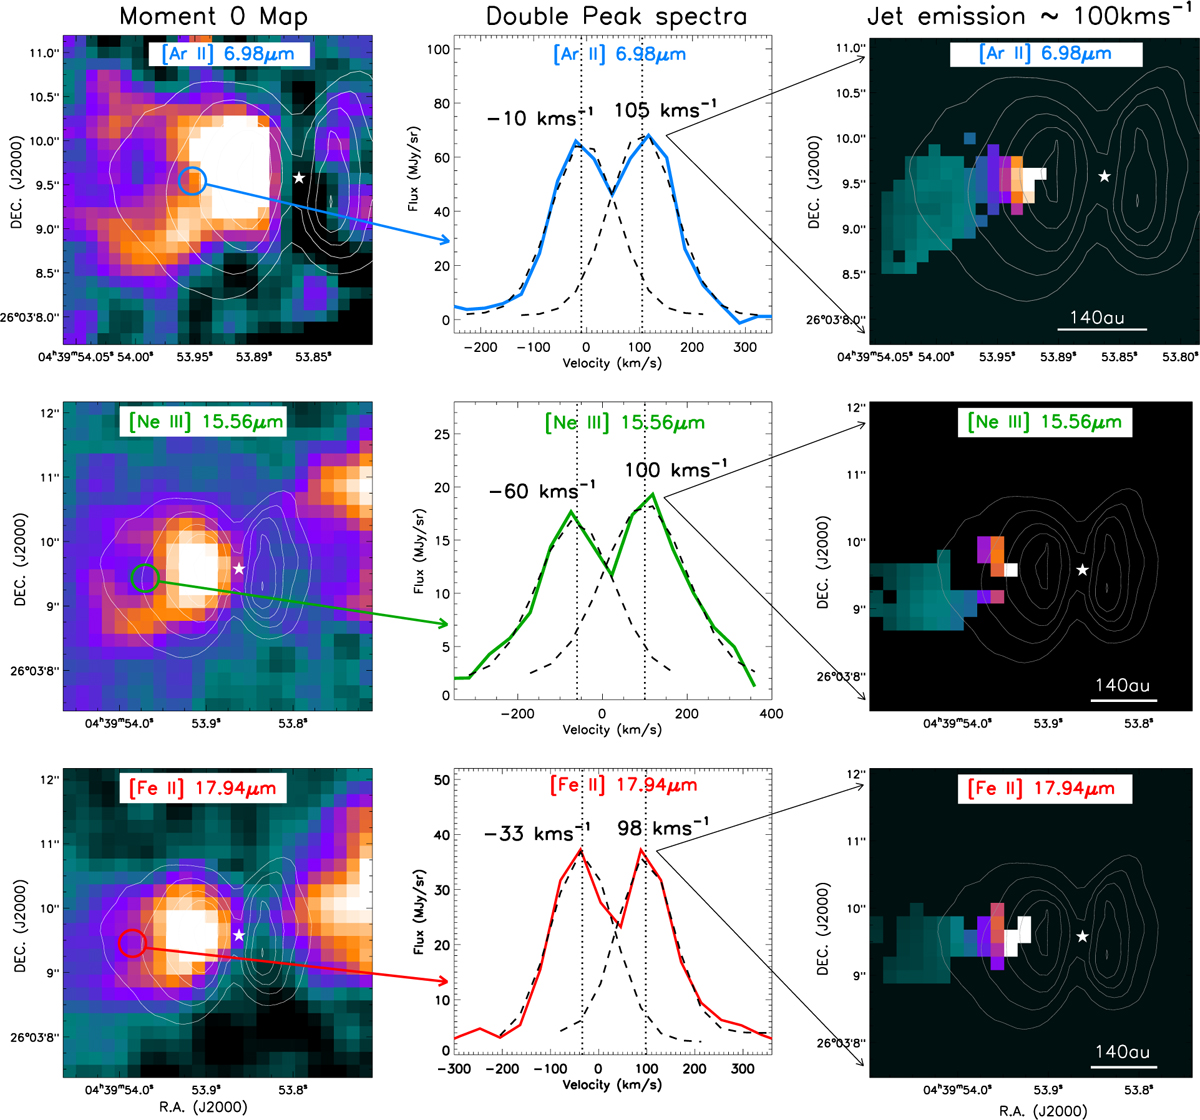
Double-peaked emission observed in the [Ar II], [Ne III], and [FeII] emission lines. Left column: moment 0 map of the lines with aperture positions covering sample pixels with double-peaked emission. Middle column: Spectra of a double-peaked emission line in blue, green, and red for [Ar II], [Ne III], and [Fe II], respectively. 1D Gaussian fits to each velocity component are shown in dashed lines. The estimated radial velocity values of the low- and HV components are indicated. Right column: distribution of the HV component associated with the jet emission. The brightest white-orange regions correspond to the strongest jet emission.
Current usage metrics show cumulative count of Article Views (full-text article views including HTML views, PDF and ePub downloads, according to the available data) and Abstracts Views on Vision4Press platform.
Data correspond to usage on the plateform after 2015. The current usage metrics is available 48-96 hours after online publication and is updated daily on week days.
Initial download of the metrics may take a while.