Open Access
Fig. 11.
Download original image
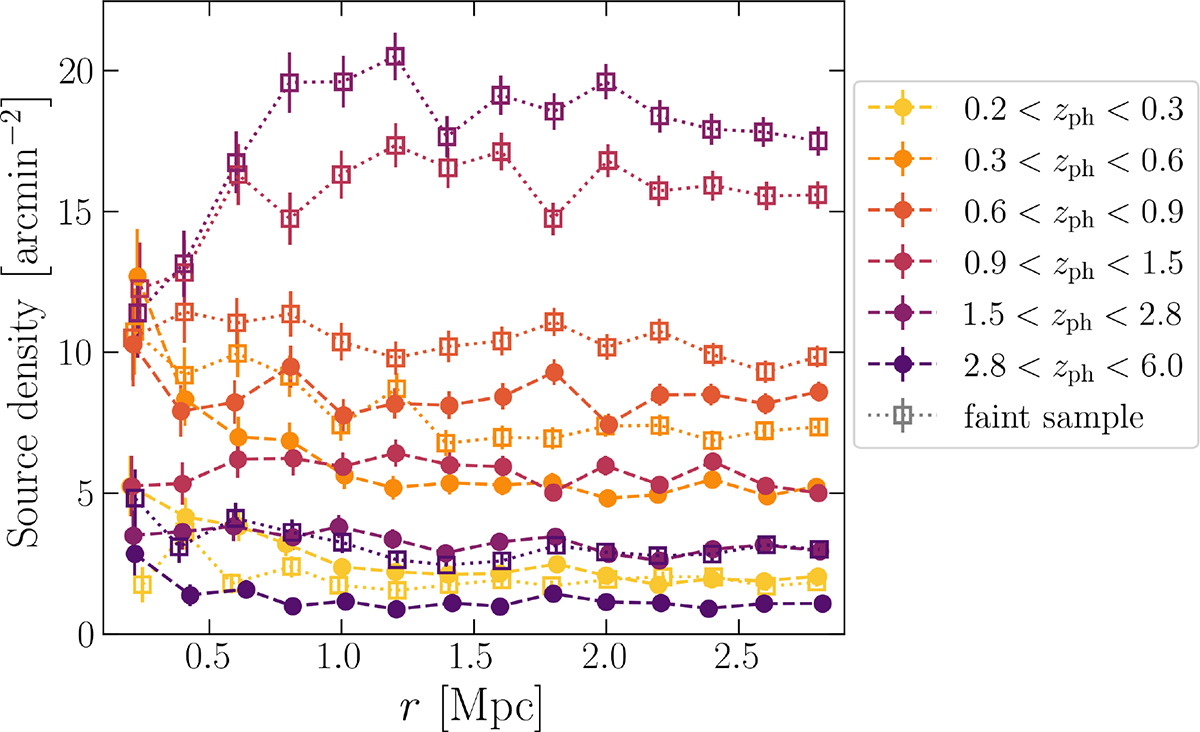
Number density profiles of WL sources in bins of photo-z (colour-coded) and magnitude, where the solid and open symbols correspond to the bright and faint sample, respectively. Error-bars indicate Poisson uncertainties. In this figure, we account for masked areas, but not for obscuration.
Current usage metrics show cumulative count of Article Views (full-text article views including HTML views, PDF and ePub downloads, according to the available data) and Abstracts Views on Vision4Press platform.
Data correspond to usage on the plateform after 2015. The current usage metrics is available 48-96 hours after online publication and is updated daily on week days.
Initial download of the metrics may take a while.