Fig. 1
Download original image
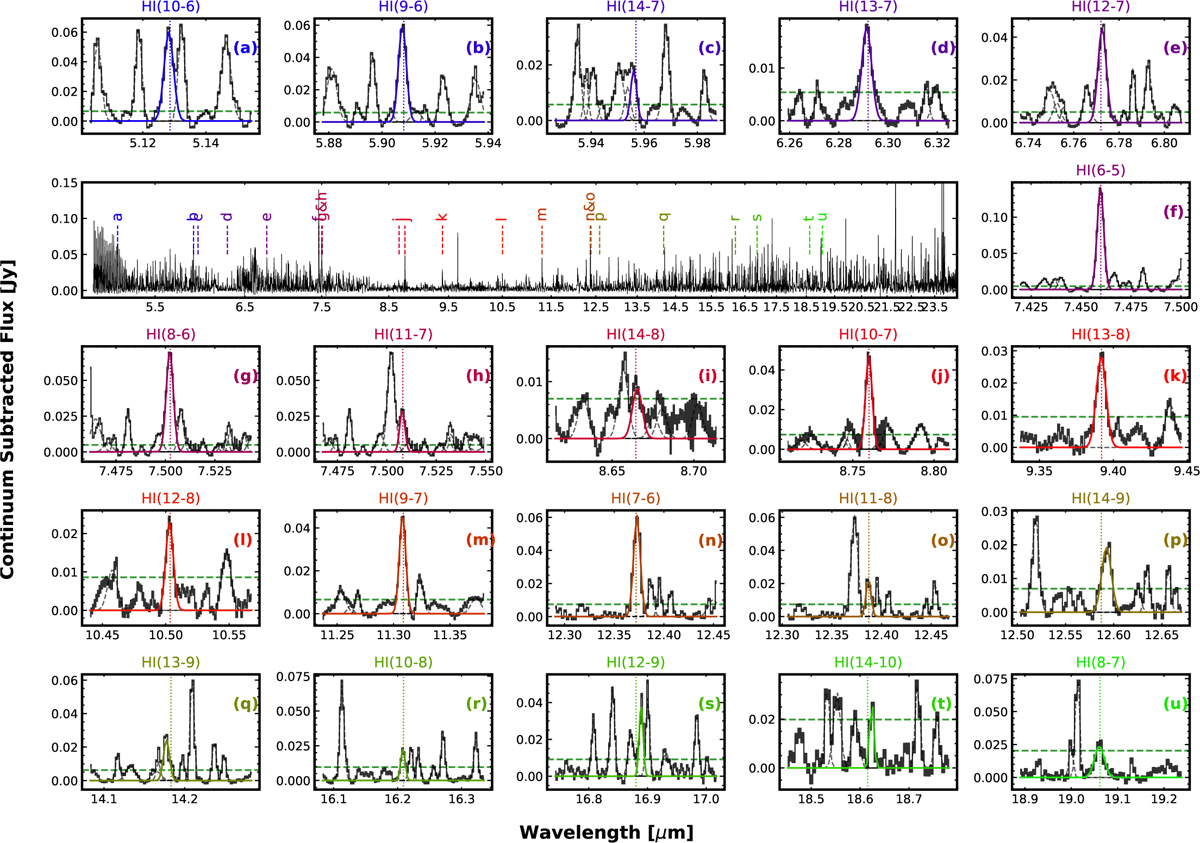
Continuum-subtracted JWST/MIRI spectrum of FT Tau. The main panel shows the full MIRI spectrum from 5 to 24 µm, with the positions of 22 H i transitions marked. Sub-panels (a) through (u) show Gaussian fits (coloured curves) to individual H i line profiles used in the analysis. The horizontal dashed green line indicates the 10 × RMS threshold used for line identification.
Current usage metrics show cumulative count of Article Views (full-text article views including HTML views, PDF and ePub downloads, according to the available data) and Abstracts Views on Vision4Press platform.
Data correspond to usage on the plateform after 2015. The current usage metrics is available 48-96 hours after online publication and is updated daily on week days.
Initial download of the metrics may take a while.