Fig. B.1
Download original image
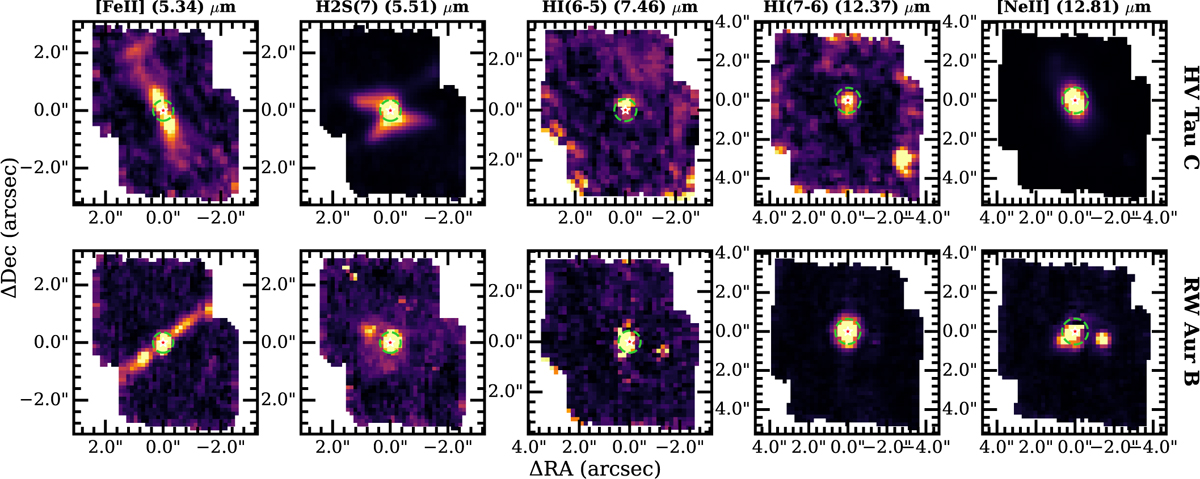
Continuum-subtracted emission-line maps. Respective maps of [Fe II], H2 S(7), and selected H i transitions for two representative sources: HV Tau C (top row) and RW Aur B (bottom row) are shown. The green circle marks the 2×PSF FWHM extraction region used for spectral analysis. The red star indicates the 14 µm continuum peak position. Despite the presence of extended outflows in [Fe II], the H i lines are spatially unresolved within the 2×PSF region. Minor spatial shifts between cubes are due to residual pointing jitter (0.2′–0.3′) across spectral channels.
Current usage metrics show cumulative count of Article Views (full-text article views including HTML views, PDF and ePub downloads, according to the available data) and Abstracts Views on Vision4Press platform.
Data correspond to usage on the plateform after 2015. The current usage metrics is available 48-96 hours after online publication and is updated daily on week days.
Initial download of the metrics may take a while.