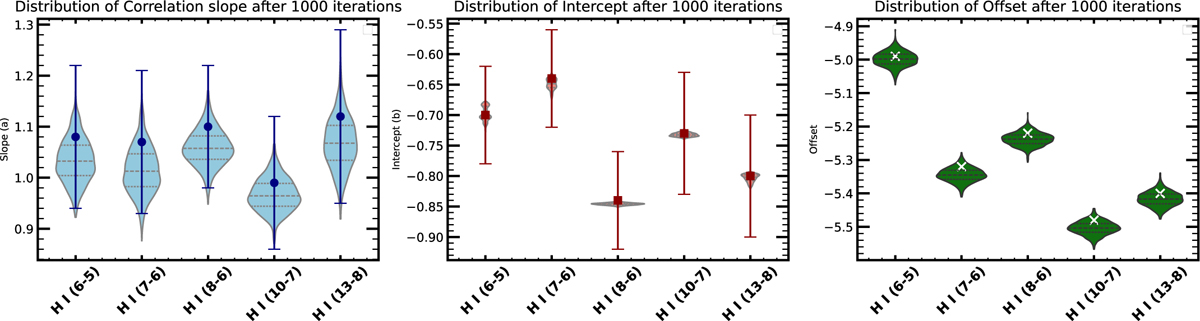
Fig. C.1
Download original image
Effect of accretion variability. The sub-panels display the distributions of the correlation slope, intercept, and offset as violin plots from the Monte Carlo simulations, used to assess the impact of variability on the best-fit empirical relations in Table 1. The bars and ’x’-markers overlaid on the violin plots indicate the reported slope, intercept, and offset values for each line from Table 1. The reported uncertainties incorporate the simulated ±50% variability to the measured line fluxes to account for non-contemporaneous log(Lacc) measurements.
Current usage metrics show cumulative count of Article Views (full-text article views including HTML views, PDF and ePub downloads, according to the available data) and Abstracts Views on Vision4Press platform.
Data correspond to usage on the plateform after 2015. The current usage metrics is available 48-96 hours after online publication and is updated daily on week days.
Initial download of the metrics may take a while.