Fig. 2
Download original image
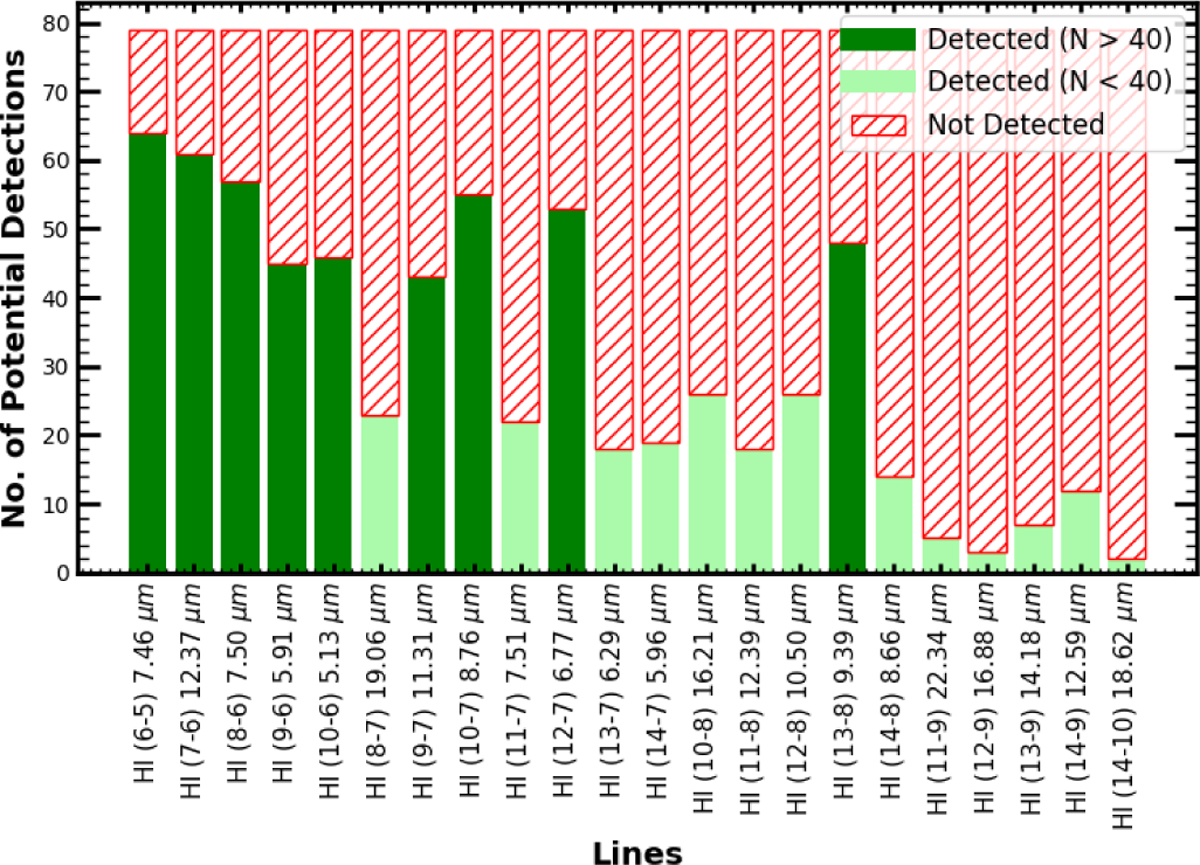
H i line detection statistics. Vertical stacked bar plot showing the detection statistics of H i emission lines in our sample. Dark green bars denote lines detected in more than 40 sources, which are analysed in detail in this work. Light green bars correspond to lines detected in fewer than 40 sources, and red-hatched bars indicate the number of non-detections for each line.
Current usage metrics show cumulative count of Article Views (full-text article views including HTML views, PDF and ePub downloads, according to the available data) and Abstracts Views on Vision4Press platform.
Data correspond to usage on the plateform after 2015. The current usage metrics is available 48-96 hours after online publication and is updated daily on week days.
Initial download of the metrics may take a while.