Fig. 3
Download original image
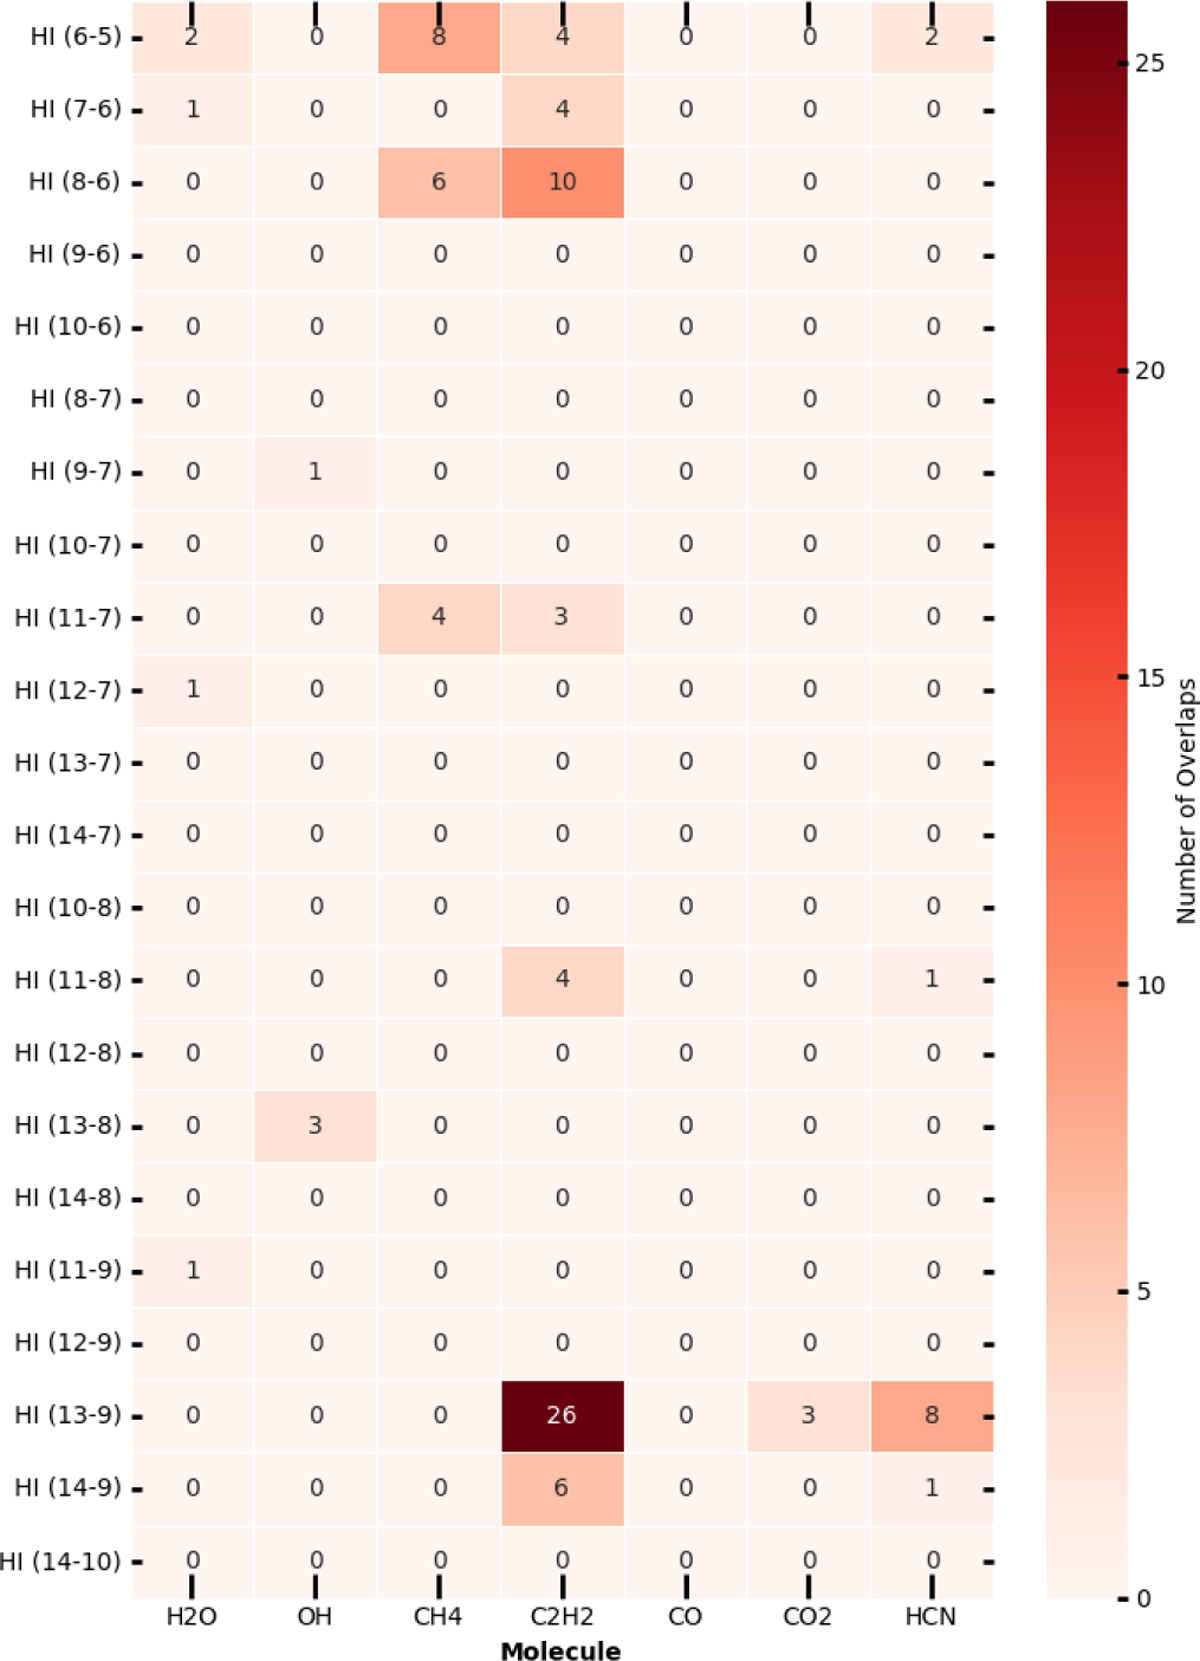
Heatmap showing the overlap of molecular transitions with the H i. Each cell represents the number of molecular lines (Eup < 5000 K) from species such as H2O, HCN, CH4, C2H2, CO, and CO2 that fall within ±1 ∆λ of the rest wavelength of a given H i transition. Darker colours indicate a higher number of overlapping molecular features, with H i (13–9) exhibiting the strongest contamination, primarily from CH4 and H2O. Based on our analysis, lines such as H i (9–6), H i (10–6), and H i (10–7) do not show significant molecular contamination.
Current usage metrics show cumulative count of Article Views (full-text article views including HTML views, PDF and ePub downloads, according to the available data) and Abstracts Views on Vision4Press platform.
Data correspond to usage on the plateform after 2015. The current usage metrics is available 48-96 hours after online publication and is updated daily on week days.
Initial download of the metrics may take a while.