Fig. 4
Download original image
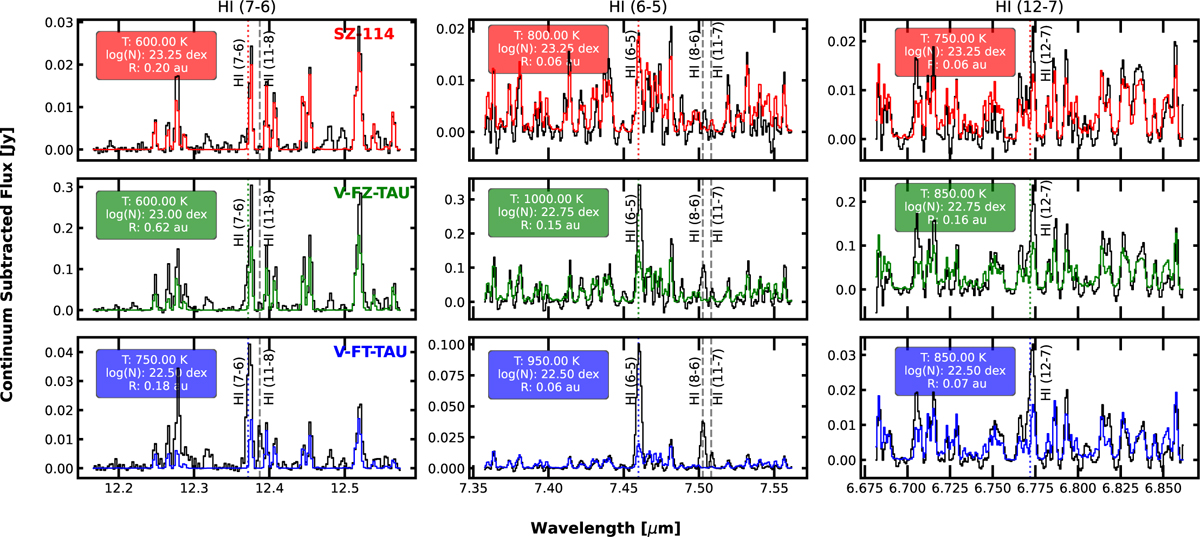
Representative best-fit LTE spectra for three Class II discs. Sz 114 (top row), FZ Tau (middle row), and FT Tau (bottom row), showing varying levels of water contribution to H i (7–6), H i (6–5), and H i (12–7) lines. In each panel, the black curve represents the continuum-subtracted JWST/MIRI spectrum, while the coloured curve shows the best-fit LTE H2O emission model. Inset boxes indicate the fitted physical parameters: temperature (T), column density (log(N)), and emitting radius (R) for the water model. Other H i lines are annotated in each of the sub-panels.
Current usage metrics show cumulative count of Article Views (full-text article views including HTML views, PDF and ePub downloads, according to the available data) and Abstracts Views on Vision4Press platform.
Data correspond to usage on the plateform after 2015. The current usage metrics is available 48-96 hours after online publication and is updated daily on week days.
Initial download of the metrics may take a while.