Fig. 5
Download original image
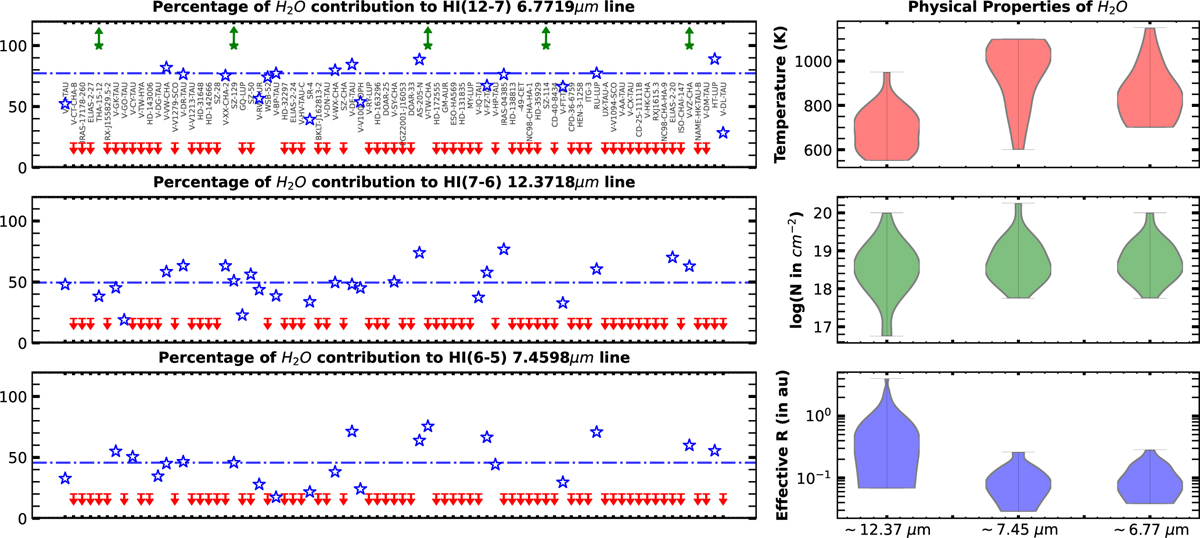
Contribution of H2O to 3 H i lines. Left panels: Estimated percentage contribution of H2O emission to the observed H i transitions—H i (12–7), H i (7–6), and H i (6–5)—across the Class II disc sample. Blue stars indicate the fractional H2O contribution for each source. Upward green arrows denote sources where the entire flux is attributable to H2O, while downward red arrows mark sources for which H2O modelling was not applied due to either dominant H i flux or negligible H2O emission. Right panels: Violin plots showing the distributions of best-fit physical parameters from LTE H2O models for each wavelength region. The temperature and effective emitting radius exhibit an anti-correlation, consistent with compact hot inner disc emission dominating at shorter wavelengths. The H2O column densities remain relatively constant across the different spectral regions.
Current usage metrics show cumulative count of Article Views (full-text article views including HTML views, PDF and ePub downloads, according to the available data) and Abstracts Views on Vision4Press platform.
Data correspond to usage on the plateform after 2015. The current usage metrics is available 48-96 hours after online publication and is updated daily on week days.
Initial download of the metrics may take a while.