Fig. 6
Download original image
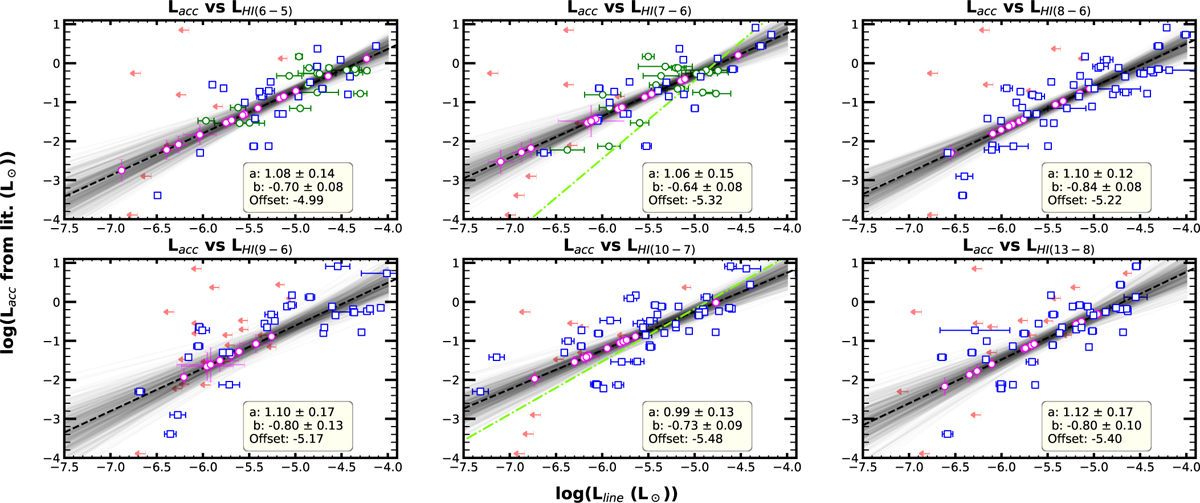
New and updated H i empirical relations. Empirical correlations between accretion luminosity (log(Lacc/L⊙)) and MIR H i line luminosities (log(Lline/L⊙)) for six transitions analysed in this work. Each panel displays the linear regression best-fit (dashed black line) with 1σ and 3σ confidence intervals (shaded regions). The best-fit slope and intercept are shown in the bottom-right corner of each panel and listed in Table 1. Blue open squares represent sources without correction for H2O contamination, while green open circles correspond to sources where the H i line fluxes have been corrected using LTE H2O models. The pink circles represent the newly measured log(Lacc) values for sources that lack literature values, while the red arrows denote 3σ upper limits for non-detections. The dash-dotted lines in the middle panels indicate the empirical relations reported by Tofflemire et al. (2025) for reference.
Current usage metrics show cumulative count of Article Views (full-text article views including HTML views, PDF and ePub downloads, according to the available data) and Abstracts Views on Vision4Press platform.
Data correspond to usage on the plateform after 2015. The current usage metrics is available 48-96 hours after online publication and is updated daily on week days.
Initial download of the metrics may take a while.