Fig. 7
Download original image
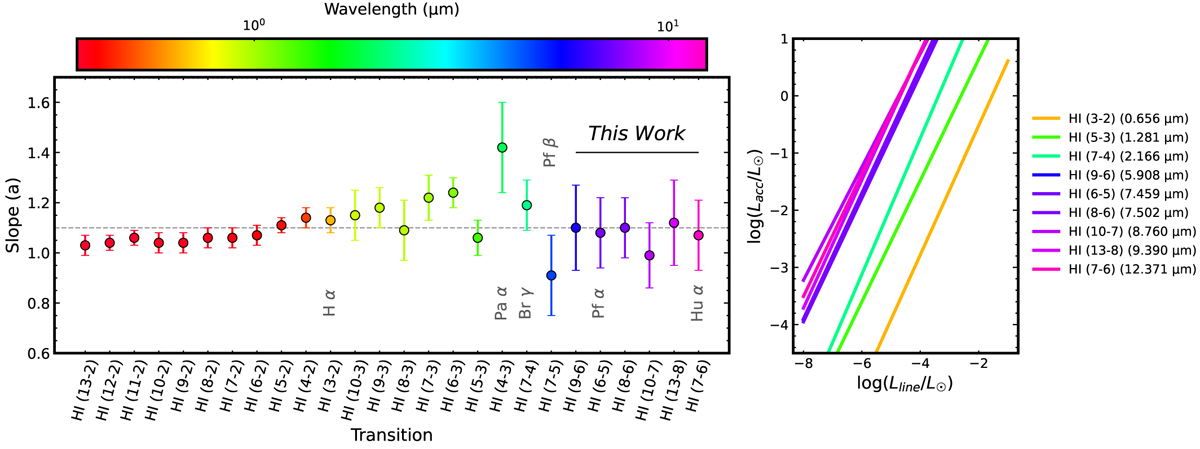
Comparison of different H i empirical relations. (Left) Estimated empirical slopes of optical/NIR H i lines from the literature (Alcalá et al. 2017; Rogers et al. 2024; Salyk et al. 2013) and mid-infrared H i lines from this work. The colour bar and marker colours indicate the wavelength of each H i transition. The median slope of the distribution is ∼1.1, shown with a dashed line. The slope of the Paα empirical relation (Rogers et al. 2024) is slightly offset from other H i lines, as it was calibrated using JWST spectra of young stars in the Large Magellanic Cloud (LMC), which has sub-solar metallicity. This lower metallicity likely affects the slope. (Right) Comparison of empirical relations between accretion luminosity (log Lacc) and line luminosity (log Lline) for representative H i transitions from optical to mid-infrared wavelengths. The slopes are consistent across this wide wavelength range.
Current usage metrics show cumulative count of Article Views (full-text article views including HTML views, PDF and ePub downloads, according to the available data) and Abstracts Views on Vision4Press platform.
Data correspond to usage on the plateform after 2015. The current usage metrics is available 48-96 hours after online publication and is updated daily on week days.
Initial download of the metrics may take a while.