Fig. 8
Download original image
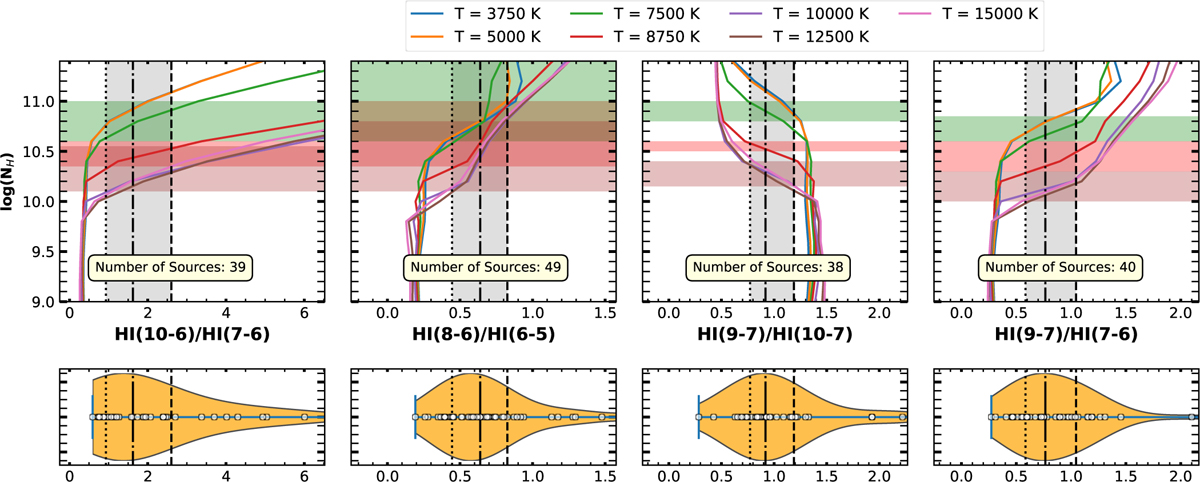
Comparison of observed mid-infrared (MIR) H i line ratios with model predictions from KF11. Top panels show theoretical line ratio curves as a function of hydrogen density (nH) for different gas temperatures, with coloured curves corresponding to temperatures ranging from 3750 K to 15 000 K. Vertical lines represent the observed median (dash-dotted), 25th percentile (dotted), and 75th percentile (dashed) values for each ratio. The bottom panels display horizontal violin plots of the observed line ratios from our sample, with circles indicating individual ratio values. In each of the top panels, the shaded regions show the inferred range of nH values for three different temperature grids, with the colours corresponding to the respective temperatures (green for T=7500K, red for T=8750, and brown for T=12 500 K). These comparisons demonstrate the sensitivity of certain MIR H i line ratios (e.g. H i (10–6)/H i (7–6), H i (9–7)/H i (10–7)) to hydrogen densities ≳ 1010.2 cm−3.
Current usage metrics show cumulative count of Article Views (full-text article views including HTML views, PDF and ePub downloads, according to the available data) and Abstracts Views on Vision4Press platform.
Data correspond to usage on the plateform after 2015. The current usage metrics is available 48-96 hours after online publication and is updated daily on week days.
Initial download of the metrics may take a while.