Fig. 9
Download original image
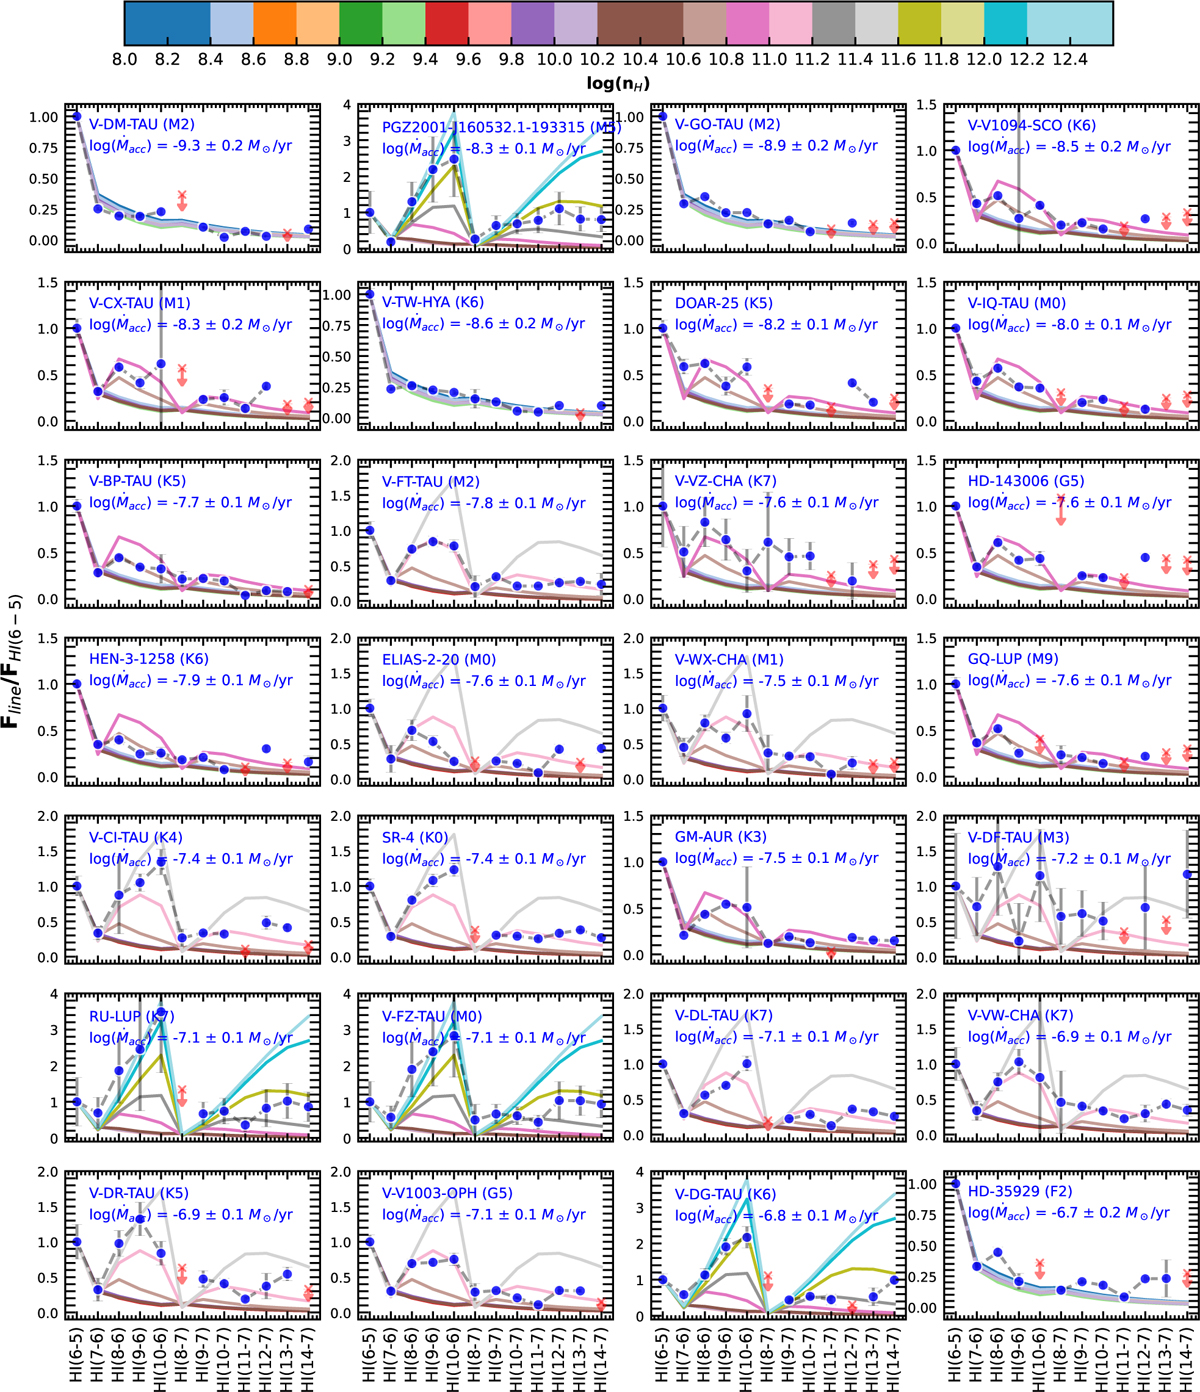
Comparison of observed and modelled H i line decrements. The ratios are normalized to H i (6–5) for a sample of Class II sources and overlaid with model predictions from KF11 at a fixed temperature of 8750 K. Each panel corresponds to an individual source, with blue-filled circles representing the observed line ratios and downward red arrows denoting upper limits for non-detections. Coloured model curves indicate the predicted line ratios for varying hydrogen densities shown in the colour bar above.
Current usage metrics show cumulative count of Article Views (full-text article views including HTML views, PDF and ePub downloads, according to the available data) and Abstracts Views on Vision4Press platform.
Data correspond to usage on the plateform after 2015. The current usage metrics is available 48-96 hours after online publication and is updated daily on week days.
Initial download of the metrics may take a while.