Fig. 1.
Download original image
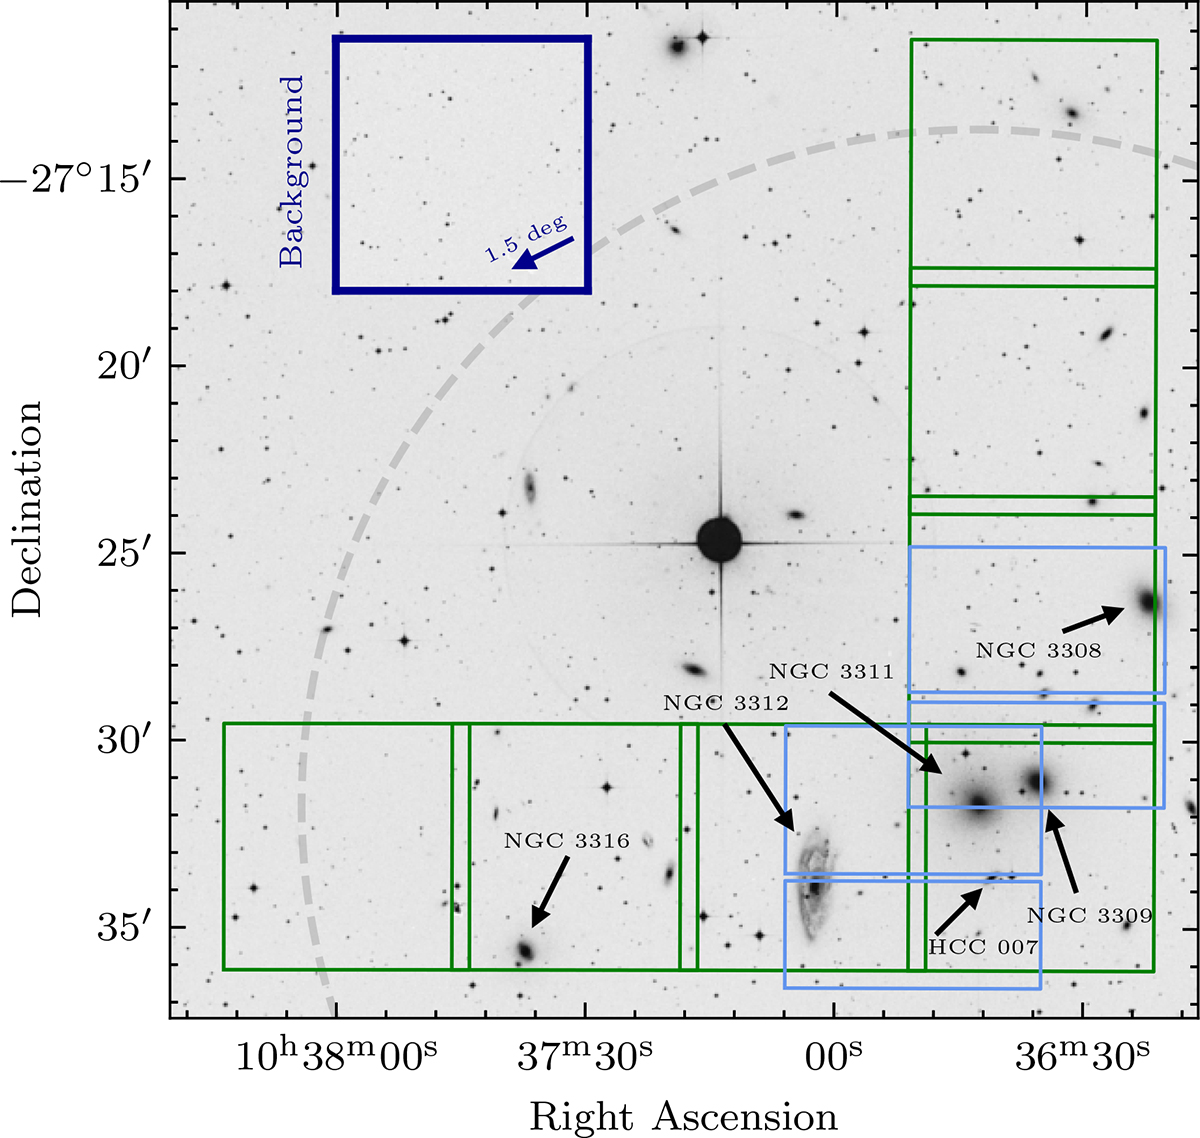
Optical image of the centre of the Hydra I cluster obtained from the Digitized Sky Survey. The green squares show the region covered by the seven 6.8′×6.8′ FORS1 pointings from which we obtained the V and I photometry for our GC candidates, while the blue squares show the regions with U-band coverage. The dark blue inset shows the background field located outside the cluster in the direction indicated by the arrow. The dashed grey circle corresponds to a radius of 0.15 Rvir = 240 kpc.
Current usage metrics show cumulative count of Article Views (full-text article views including HTML views, PDF and ePub downloads, according to the available data) and Abstracts Views on Vision4Press platform.
Data correspond to usage on the plateform after 2015. The current usage metrics is available 48-96 hours after online publication and is updated daily on week days.
Initial download of the metrics may take a while.