Open Access
Fig. 10.
Download original image
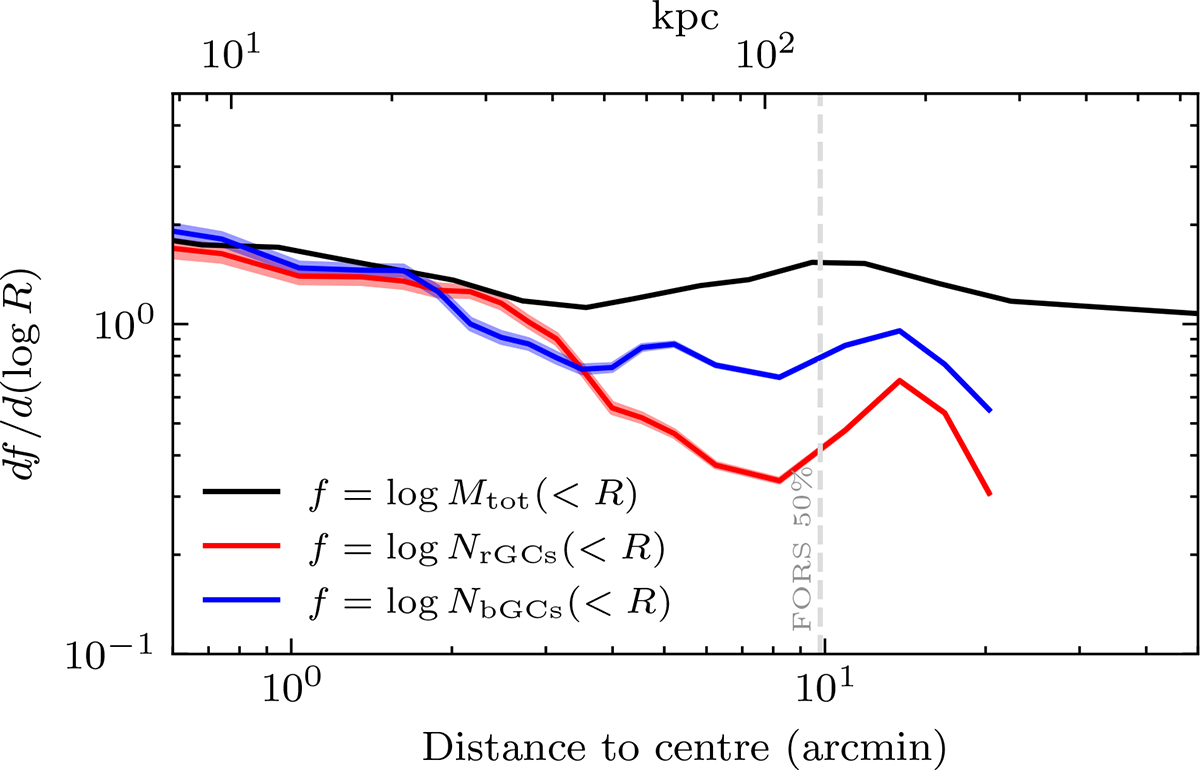
Logarithmic slope of the total cumulative mass profile (black) modelled by Hayakawa et al. (2006) from X-ray observations compared to that derived from the cumulative number of GCs (red and blue). The dashed line shows the distance where the coverage of our data goes down to 50% of the X-ray coverage at the same distance.
Current usage metrics show cumulative count of Article Views (full-text article views including HTML views, PDF and ePub downloads, according to the available data) and Abstracts Views on Vision4Press platform.
Data correspond to usage on the plateform after 2015. The current usage metrics is available 48-96 hours after online publication and is updated daily on week days.
Initial download of the metrics may take a while.