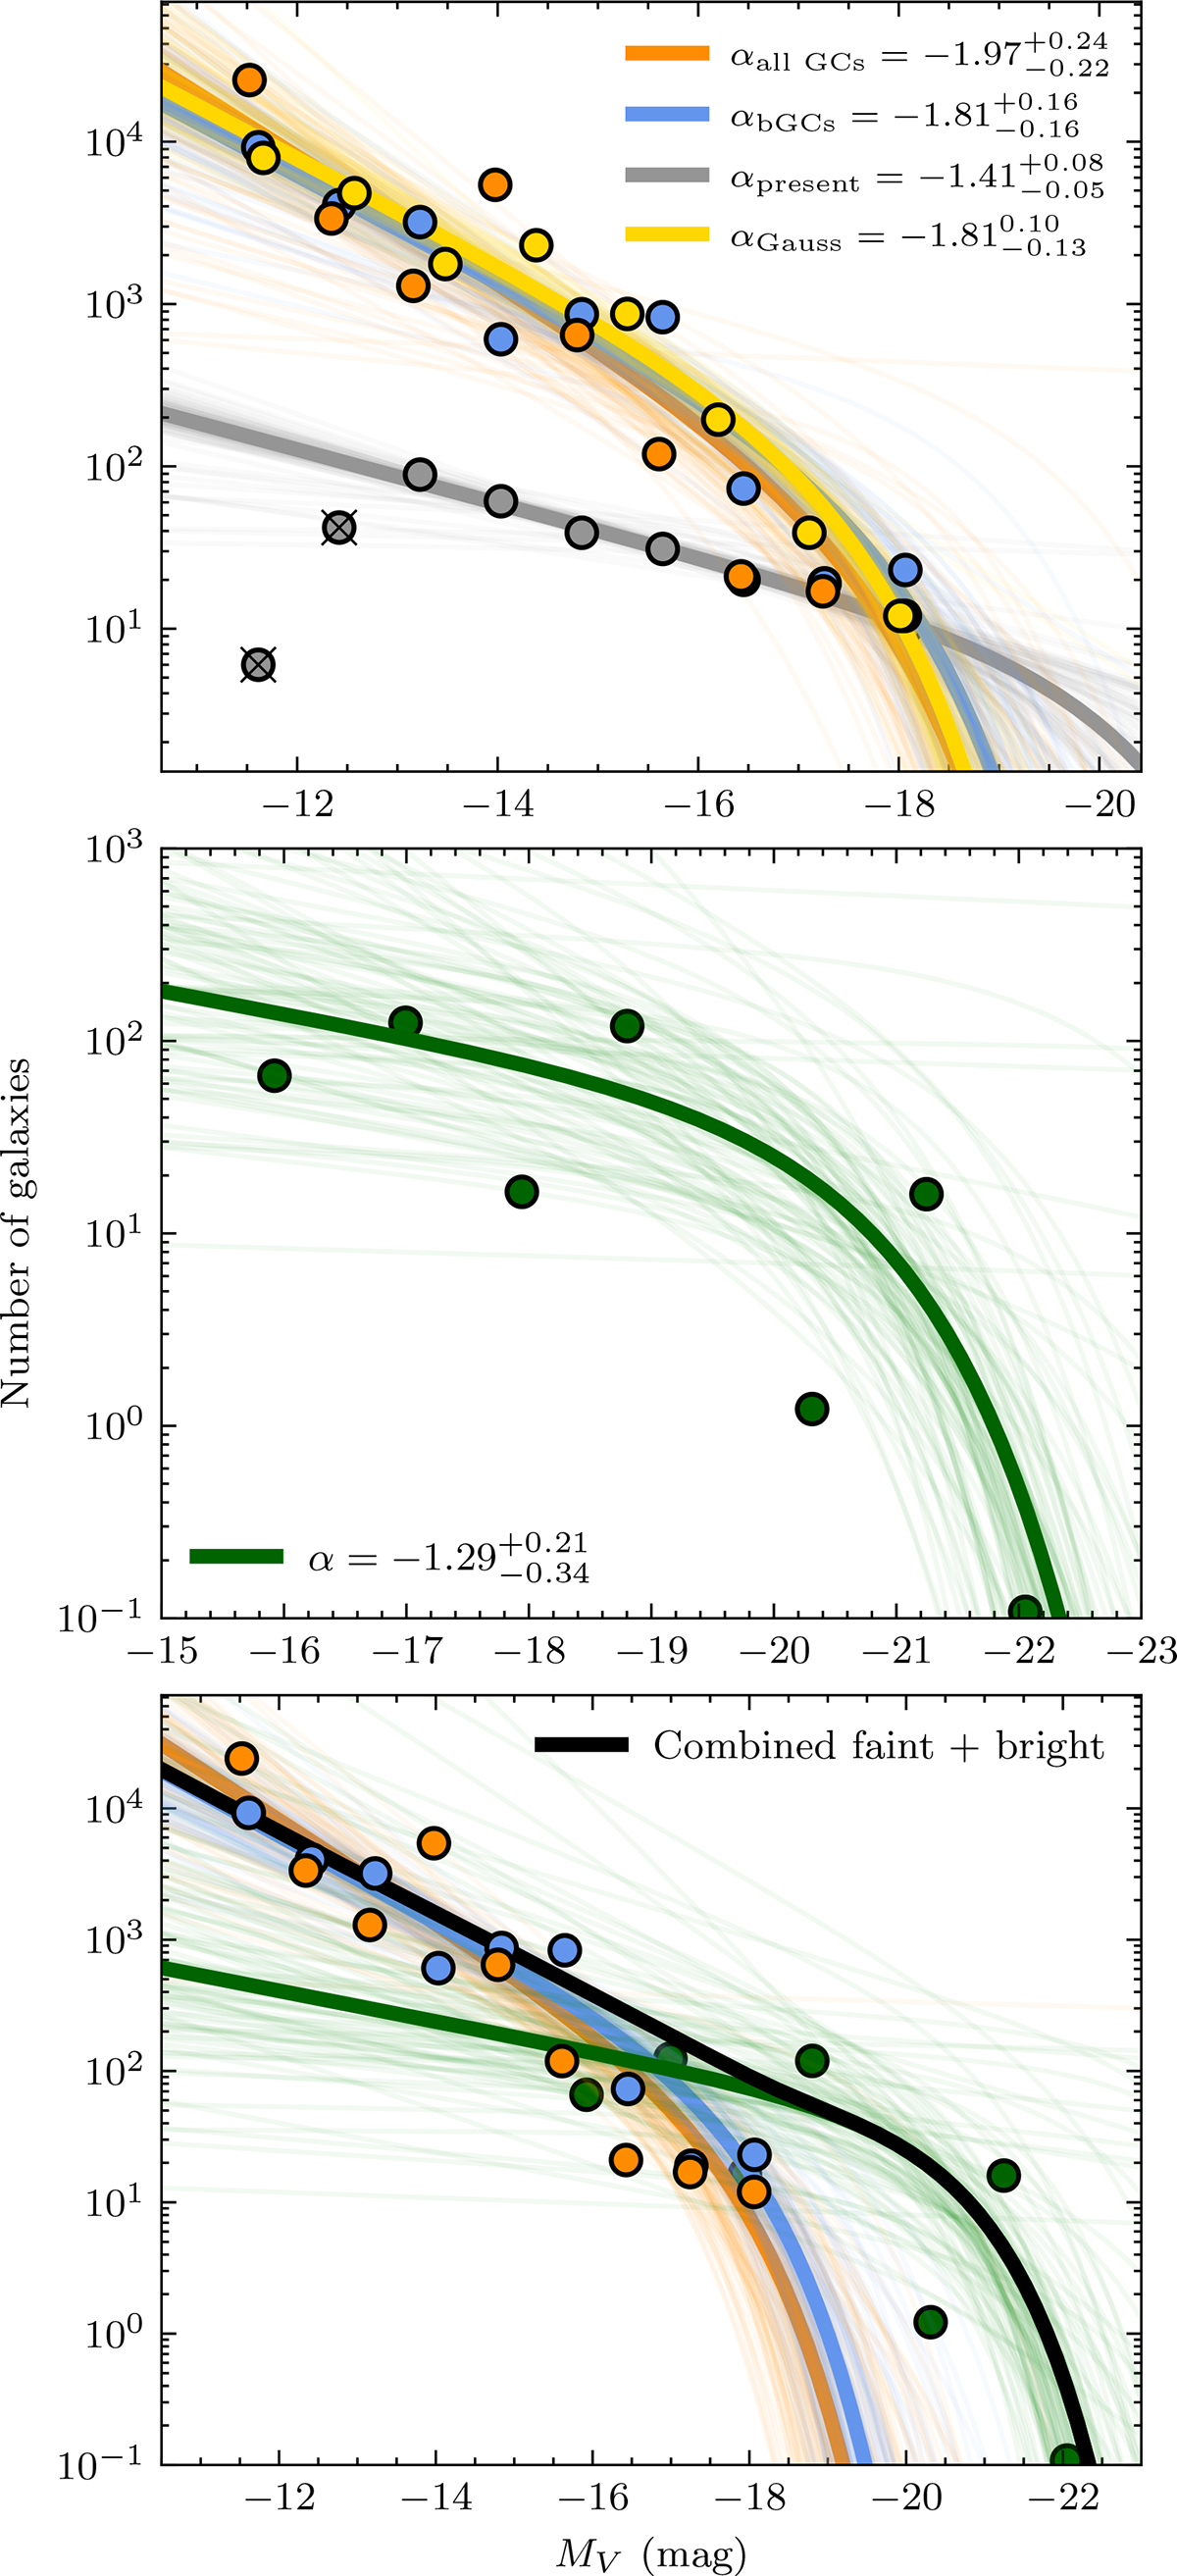
Fig. 12.
Download original image
Constraints to the past luminosity function of Hydra I. Top: The faint end of the luminosity function. As grey points, we plot the data from the dwarf galaxy census by La Marca et al. (2022), while in orange and blue we plot the predicted number of destroyed dwarf galaxies added to the present-day LF from all GCs and bGCs only, respectively. The golden points show the constraint taking into account the GC occupation factor and the scatter in magnitude from the SN–MV relation. Thick lines show the Schechter fit with maximum likelihood to our data, while thin lines represent random draws from our MCMC posteriors. Crossed data points were not considered for their respective Schechter fit as they suffer from incompleteness. Middle: Bright-end luminosity function prediction from fitting GC colour templates to the observed colour distributions from all radial bins. Bottom: combined constrain from both methods, considering the blue curve for the faint-end.
Current usage metrics show cumulative count of Article Views (full-text article views including HTML views, PDF and ePub downloads, according to the available data) and Abstracts Views on Vision4Press platform.
Data correspond to usage on the plateform after 2015. The current usage metrics is available 48-96 hours after online publication and is updated daily on week days.
Initial download of the metrics may take a while.