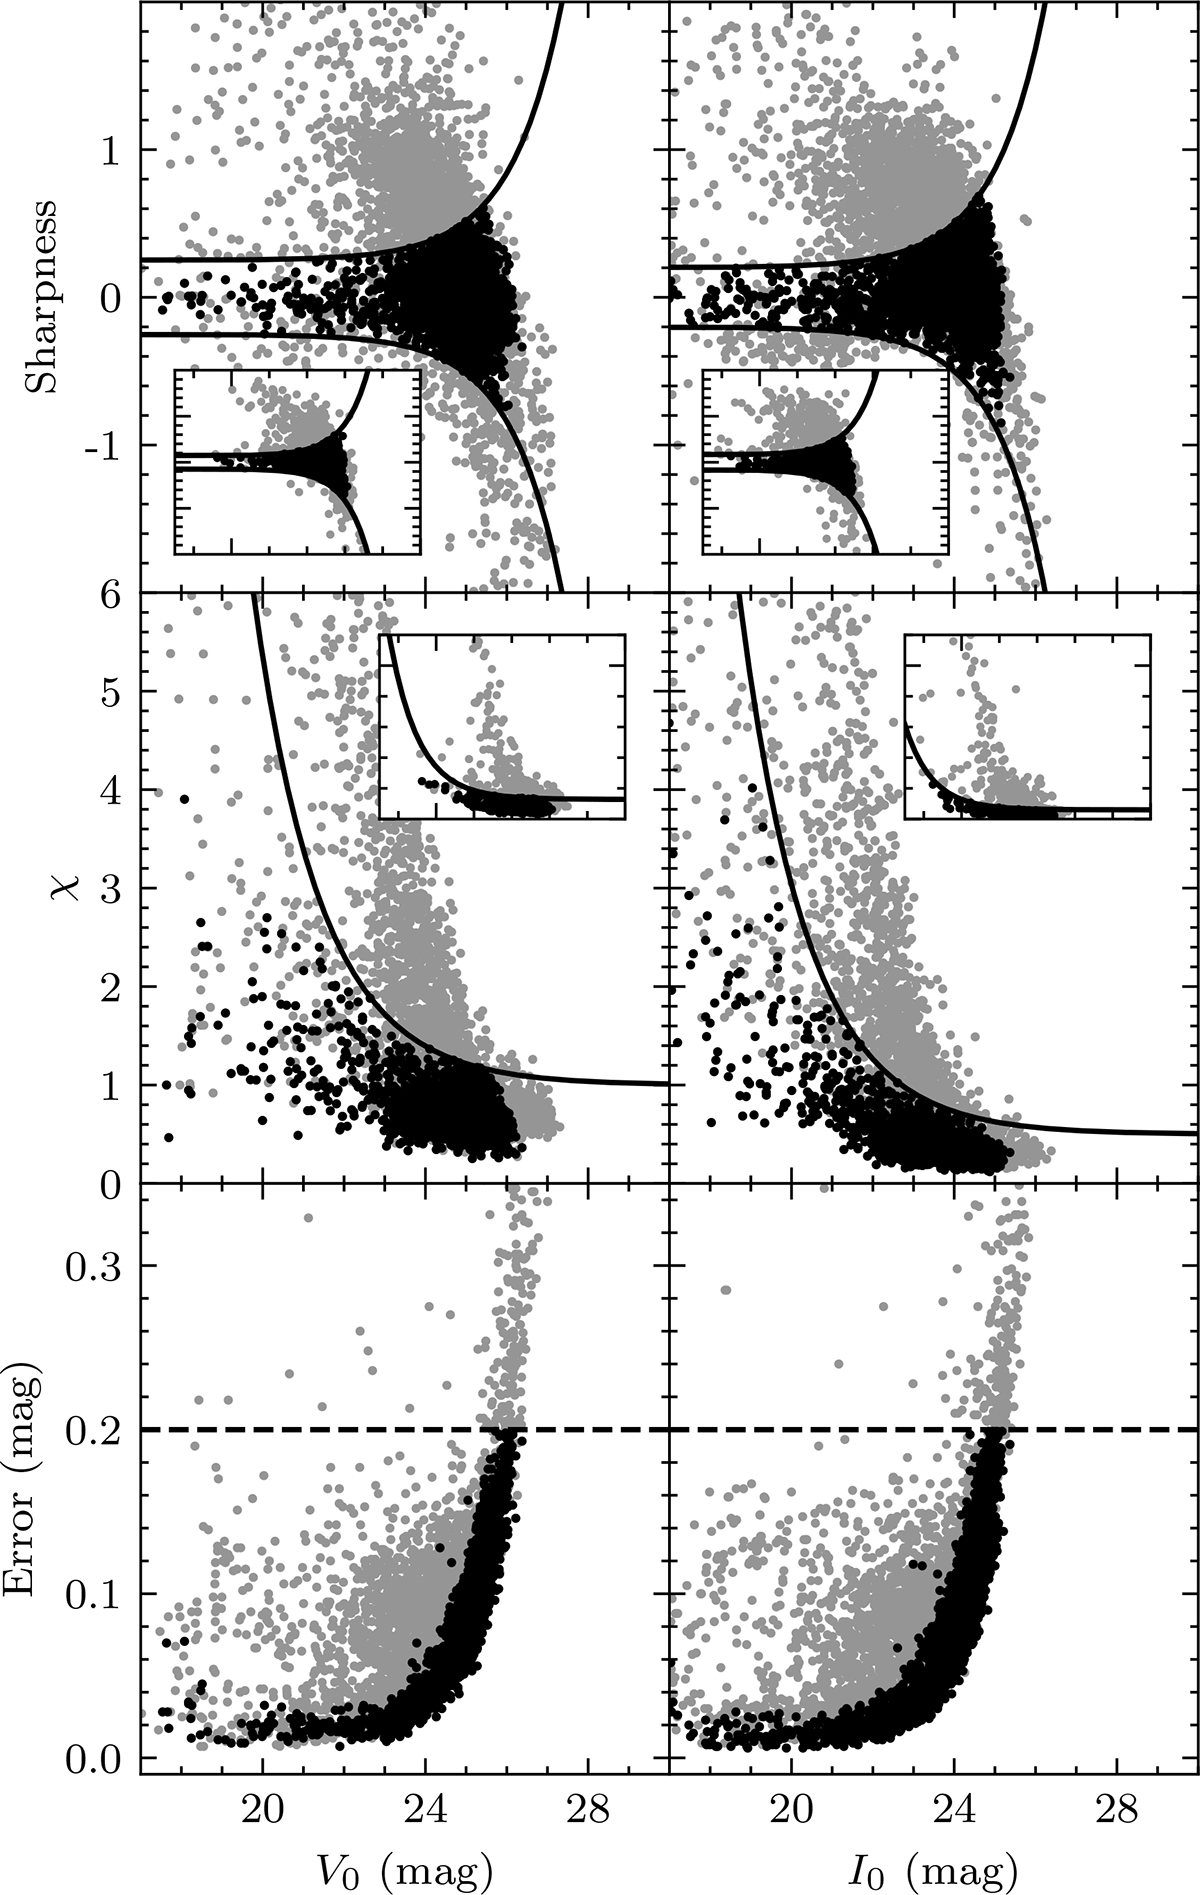
Fig. A.1.
Download original image
Point source selection from the photometry in the extinction-corrected V and I bands (left and right columns, respectively). The black exponential curves show the threshold used for our cuts in sharpness and χ (top and middle panels, respectively), while the dashed horizontal line indicates the adopted limit for the photometric error (bottom panel). The black points are the sources that satisfy our criteria in all three parameters, which we refer as point sources. For better visualisation, we only plot a randomly drawn subsample of 5000 data points. The insets show the respective cuts for the central field, where our photometry is more accurate. The insets are plotted with the same axis ranges as in the main panel.
Current usage metrics show cumulative count of Article Views (full-text article views including HTML views, PDF and ePub downloads, according to the available data) and Abstracts Views on Vision4Press platform.
Data correspond to usage on the plateform after 2015. The current usage metrics is available 48-96 hours after online publication and is updated daily on week days.
Initial download of the metrics may take a while.