Fig. 6.
Download original image
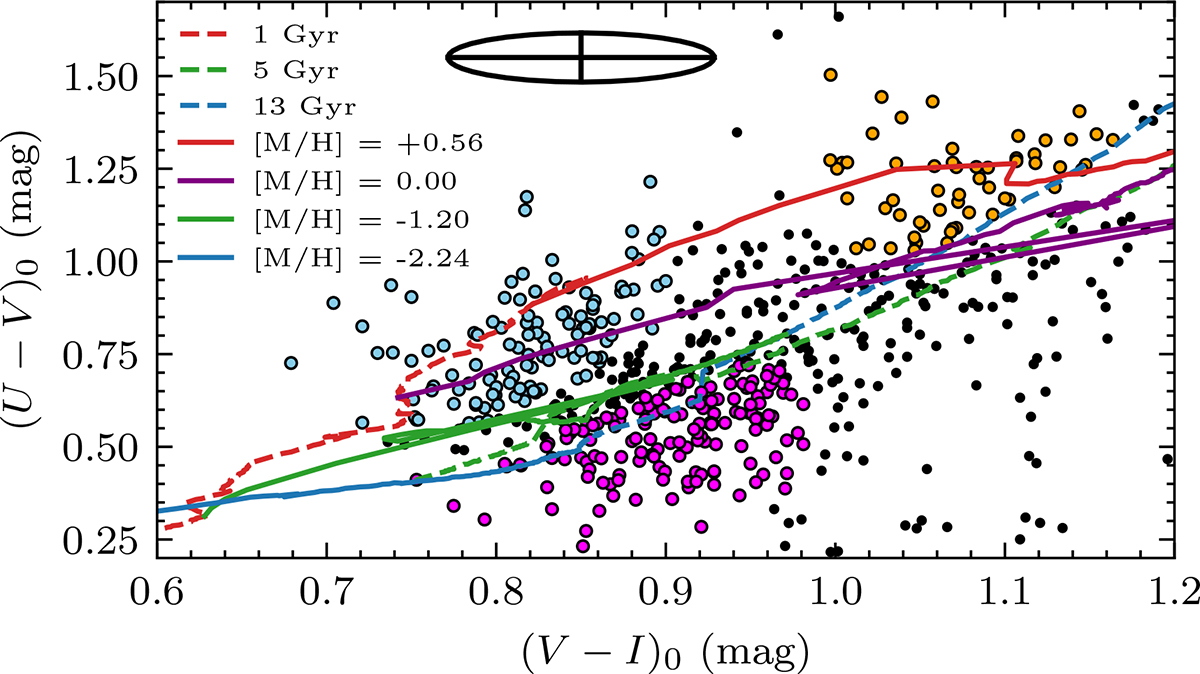
UVI colour-magnitude diagram of GC candidates with photometric error ≤0.07 mag in each band (dots). The lines correspond to stellar tracks of constant age (dashed) and constant metallicity (solid) derived from the PARSEC models (Bressan et al. 2012). The black ellipse represents the mean errors in colour. We select three subpopulations of GCs based on the PARSEC tracks: young, metal-rich (light blue), old, metal-rich (orange), and old, metal-poor (magenta).
Current usage metrics show cumulative count of Article Views (full-text article views including HTML views, PDF and ePub downloads, according to the available data) and Abstracts Views on Vision4Press platform.
Data correspond to usage on the plateform after 2015. The current usage metrics is available 48-96 hours after online publication and is updated daily on week days.
Initial download of the metrics may take a while.